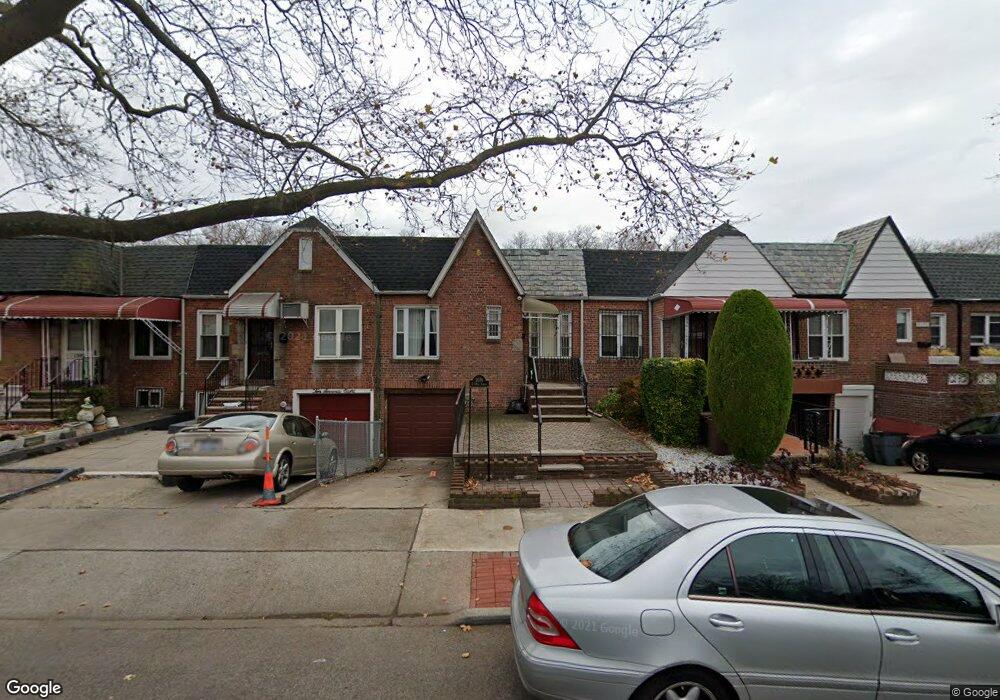
1076 E 52nd St Brooklyn, NY 11234
Flatlands NeighborhoodEstimated Value: $504,000 - $676,000
Studio
--
Bath
906
Sq Ft
$655/Sq Ft
Est. Value
About This Home
This home is located at 1076 E 52nd St, Brooklyn, NY 11234 and is currently estimated at $593,735, approximately $655 per square foot. 1076 E 52nd St is a home located in Kings County with nearby schools including Ebenezer Preparatory School, Christian Heritage Academy, and Great Oaks Elementary School.
Ownership History
Date
Name
Owned For
Owner Type
Purchase Details
Closed on
Jul 2, 2008
Sold by
Campbell Ann Marie
Bought by
Campbell Ann Marie and Campbell Stephanie
Current Estimated Value
Purchase Details
Closed on
Aug 26, 2005
Sold by
Campbell Ann Marie and Ridge Alvado
Bought by
Campbell Ann Marie
Purchase Details
Closed on
Oct 31, 2003
Sold by
Huggs Elaine Farmer
Bought by
Cambell Ann Marie and Ridge Alvado
Home Financials for this Owner
Home Financials are based on the most recent Mortgage that was taken out on this home.
Original Mortgage
$265,700
Interest Rate
5.36%
Mortgage Type
Purchase Money Mortgage
Purchase Details
Closed on
Aug 29, 1995
Sold by
Wechsler Leonard
Bought by
Huggs Elaine Farmer
Purchase Details
Closed on
Jul 10, 1995
Sold by
Gold Dorothy
Bought by
Wechsler Leonard
Create a Home Valuation Report for This Property
The Home Valuation Report is an in-depth analysis detailing your home's value as well as a comparison with similar homes in the area
Home Values in the Area
Average Home Value in this Area
Purchase History
| Date | Buyer | Sale Price | Title Company |
|---|---|---|---|
| Campbell Ann Marie | -- | -- | |
| Campbell Ann Marie | -- | -- | |
| Campbell Ann Marie | -- | -- | |
| Campbell Ann Marie | -- | -- | |
| Cambell Ann Marie | $274,000 | -- | |
| Cambell Ann Marie | $274,000 | -- | |
| Huggs Elaine Farmer | $65,000 | Commonwealth Land Title Ins | |
| Huggs Elaine Farmer | $65,000 | Commonwealth Land Title Ins | |
| Wechsler Leonard | -- | Commonwealth Land Title Ins | |
| Wechsler Leonard | -- | Commonwealth Land Title Ins |
Source: Public Records
Mortgage History
| Date | Status | Borrower | Loan Amount |
|---|---|---|---|
| Previous Owner | Cambell Ann Marie | $265,700 | |
| Closed | Campbell Ann Marie | $0 |
Source: Public Records
Tax History
| Year | Tax Paid | Tax Assessment Tax Assessment Total Assessment is a certain percentage of the fair market value that is determined by local assessors to be the total taxable value of land and additions on the property. | Land | Improvement |
|---|---|---|---|---|
| 2025 | $5,584 | $40,440 | $10,440 | $30,000 |
| 2024 | $5,584 | $31,920 | $10,440 | $21,480 |
| 2023 | $5,311 | $37,320 | $10,440 | $26,880 |
| 2022 | $4,902 | $30,540 | $10,440 | $20,100 |
| 2021 | $5,174 | $31,560 | $10,440 | $21,120 |
| 2020 | $2,551 | $38,280 | $10,440 | $27,840 |
| 2019 | $4,798 | $32,220 | $10,440 | $21,780 |
| 2018 | $4,383 | $22,959 | $8,087 | $14,872 |
| 2017 | $4,116 | $21,660 | $10,440 | $11,220 |
| 2016 | $4,176 | $22,440 | $10,440 | $12,000 |
| 2015 | $2,404 | $22,882 | $10,490 | $12,392 |
| 2014 | $2,404 | $21,587 | $10,137 | $11,450 |
Source: Public Records
Map
Nearby Homes
- 5042 Kings Hwy
- 1033 E 52nd St
- 904 E 54th St
- 5415 Glenwood Rd
- 1200 E 49th St
- 877 E 55th St
- 1226 E 51st St
- 1700 Utica Ave
- 827 E 55th St
- 21 Preston Ct
- 1650 Schenectady Ave
- 973 E 48th St
- 5018 Avenue I
- 1240 E 48th St
- 1275 E 51st St Unit 3H
- 1275 E 51st St Unit 5M
- 1275 E 51st St Unit 3Y
- 1275 E 51st St Unit 3W
- 1275 E 51st St Unit 3C
- 1275 E 51st St Unit 4M
Your Personal Tour Guide
Ask me questions while you tour the home.