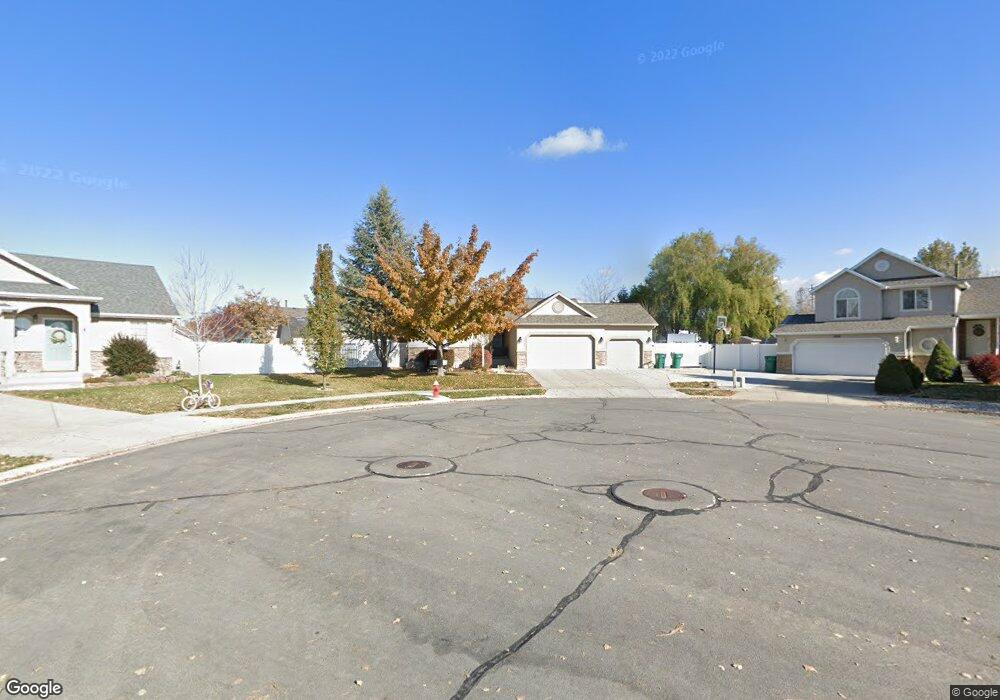
1076 N 3500 W Layton, UT 84041
Estimated Value: $526,000 - $555,000
3
Beds
2
Baths
1,357
Sq Ft
$399/Sq Ft
Est. Value
About This Home
This home is located at 1076 N 3500 W, Layton, UT 84041 and is currently estimated at $541,300, approximately $398 per square foot. 1076 N 3500 W is a home located in Davis County with nearby schools including Sand Springs Elementary School, Legacy Junior High School, and Layton High School.
Ownership History
Date
Name
Owned For
Owner Type
Purchase Details
Closed on
Sep 18, 2020
Sold by
Ricks Chris and Ricks Amy
Bought by
Ricks Christopher and Ricks Amy
Current Estimated Value
Home Financials for this Owner
Home Financials are based on the most recent Mortgage that was taken out on this home.
Original Mortgage
$141,000
Outstanding Balance
$125,128
Interest Rate
2.9%
Mortgage Type
New Conventional
Estimated Equity
$416,172
Purchase Details
Closed on
Nov 8, 2019
Sold by
Ricks Chris W and Ricks Amy
Bought by
Ricks Chris and Ricks Amy
Home Financials for this Owner
Home Financials are based on the most recent Mortgage that was taken out on this home.
Original Mortgage
$140,000
Interest Rate
3.65%
Purchase Details
Closed on
Oct 31, 2002
Sold by
Gmw Development Inc
Bought by
Ricks Chris W and Ricks Amy
Home Financials for this Owner
Home Financials are based on the most recent Mortgage that was taken out on this home.
Original Mortgage
$165,650
Interest Rate
5.99%
Create a Home Valuation Report for This Property
The Home Valuation Report is an in-depth analysis detailing your home's value as well as a comparison with similar homes in the area
Home Values in the Area
Average Home Value in this Area
Purchase History
| Date | Buyer | Sale Price | Title Company |
|---|---|---|---|
| Ricks Christopher | -- | Meridian Title Company | |
| Ricks Chris | -- | Hickman Land Title | |
| Ricks Chris W | -- | Bonneville Title Company Inc |
Source: Public Records
Mortgage History
| Date | Status | Borrower | Loan Amount |
|---|---|---|---|
| Open | Ricks Christopher | $141,000 | |
| Closed | Ricks Chris | $140,000 | |
| Previous Owner | Ricks Chris W | $165,650 |
Source: Public Records
Tax History Compared to Growth
Tax History
| Year | Tax Paid | Tax Assessment Tax Assessment Total Assessment is a certain percentage of the fair market value that is determined by local assessors to be the total taxable value of land and additions on the property. | Land | Improvement |
|---|---|---|---|---|
| 2025 | $2,594 | $272,250 | $154,361 | $117,889 |
| 2024 | $2,637 | $278,851 | $161,959 | $116,892 |
| 2023 | $2,543 | $474,000 | $178,349 | $295,651 |
| 2022 | $2,788 | $282,150 | $99,383 | $182,767 |
| 2021 | $2,478 | $374,000 | $149,019 | $224,981 |
| 2020 | $2,244 | $325,000 | $128,541 | $196,459 |
| 2019 | $2,207 | $313,000 | $124,094 | $188,906 |
| 2018 | $2,009 | $286,000 | $109,684 | $176,316 |
| 2016 | $1,762 | $129,415 | $47,139 | $82,276 |
| 2015 | $1,734 | $120,945 | $47,139 | $73,806 |
| 2014 | $1,814 | $129,370 | $47,139 | $82,231 |
| 2013 | -- | $107,882 | $31,659 | $76,223 |
Source: Public Records
Map
Nearby Homes