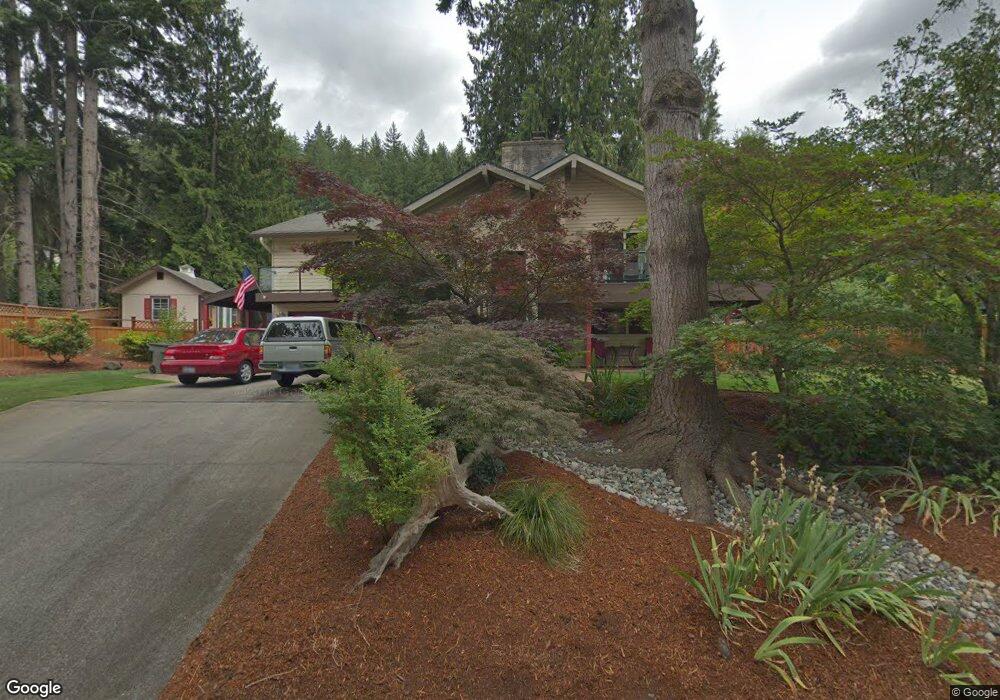
1076 NE Rindall Ct Poulsbo, WA 98370
Estimated Value: $717,338 - $858,000
4
Beds
3
Baths
1,620
Sq Ft
$480/Sq Ft
Est. Value
About This Home
This home is located at 1076 NE Rindall Ct, Poulsbo, WA 98370 and is currently estimated at $778,335, approximately $480 per square foot. 1076 NE Rindall Ct is a home located in Kitsap County with nearby schools including Poulsbo Elementary School, Poulsbo Middle School, and North Kitsap High School.
Ownership History
Date
Name
Owned For
Owner Type
Purchase Details
Closed on
Aug 25, 2015
Sold by
Azcarate Marie T
Bought by
Flores Mark Anthony and Azcarate Luis Cesar
Current Estimated Value
Home Financials for this Owner
Home Financials are based on the most recent Mortgage that was taken out on this home.
Original Mortgage
$13,774
Outstanding Balance
$10,800
Interest Rate
3.86%
Mortgage Type
Unknown
Estimated Equity
$767,535
Purchase Details
Closed on
Nov 17, 2006
Sold by
Azcarate Marie T
Bought by
Azcarate Marie T and Azcarate Luis Cesar
Home Financials for this Owner
Home Financials are based on the most recent Mortgage that was taken out on this home.
Original Mortgage
$384,000
Interest Rate
6.32%
Mortgage Type
Purchase Money Mortgage
Purchase Details
Closed on
Jun 4, 2004
Sold by
Smith William Earle and Smith Sandra Howes
Bought by
Azcarate Marie T
Home Financials for this Owner
Home Financials are based on the most recent Mortgage that was taken out on this home.
Original Mortgage
$272,000
Interest Rate
7.3%
Mortgage Type
Purchase Money Mortgage
Create a Home Valuation Report for This Property
The Home Valuation Report is an in-depth analysis detailing your home's value as well as a comparison with similar homes in the area
Home Values in the Area
Average Home Value in this Area
Purchase History
| Date | Buyer | Sale Price | Title Company |
|---|---|---|---|
| Flores Mark Anthony | $355,000 | Land Title Co Silverdale | |
| Azcarate Marie T | -- | None Available | |
| Azcarate Marie T | $303,000 | Pacific Nw Title |
Source: Public Records
Mortgage History
| Date | Status | Borrower | Loan Amount |
|---|---|---|---|
| Open | Flores Mark Anthony | $13,774 | |
| Open | Flores Mark Anthony | $344,350 | |
| Closed | Azcarate Marie T | $384,000 | |
| Closed | Azcarate Marie T | $272,000 |
Source: Public Records
Tax History Compared to Growth
Tax History
| Year | Tax Paid | Tax Assessment Tax Assessment Total Assessment is a certain percentage of the fair market value that is determined by local assessors to be the total taxable value of land and additions on the property. | Land | Improvement |
|---|---|---|---|---|
| 2026 | $5,455 | $607,920 | $121,840 | $486,080 |
| 2025 | $5,455 | $607,920 | $121,840 | $486,080 |
| 2024 | $5,154 | $591,420 | $113,930 | $477,490 |
| 2023 | $5,242 | $591,420 | $113,930 | $477,490 |
| 2022 | $4,652 | $499,070 | $98,900 | $400,170 |
| 2021 | $4,504 | $447,850 | $88,610 | $359,240 |
| 2020 | $4,381 | $427,980 | $84,660 | $343,320 |
| 2019 | $4,116 | $401,970 | $79,120 | $322,850 |
| 2018 | $3,672 | $305,680 | $60,020 | $245,660 |
| 2017 | $3,513 | $305,680 | $60,020 | $245,660 |
| 2016 | $3,610 | $289,380 | $60,020 | $229,360 |
| 2015 | $3,502 | $282,120 | $60,020 | $222,100 |
| 2014 | -- | $271,230 | $60,020 | $211,210 |
| 2013 | -- | $271,230 | $60,020 | $211,210 |
Source: Public Records
Map
Nearby Homes
- 18263 10th Ave NE
- 18330 9th Ave NE
- 649 NE Sommerseth St
- 18552 15th Loop NE
- 1610 NE Mount Kamela Ct
- 18129 Fjord Dr NE Unit B-2
- 18440 Fjord Dr NE
- 18637 Fjord Dr NE
- 18130 Sunrise Ridge Ave NE
- 0 7th Ave NE Unit NWM2459196
- 0 7th Ave NE Unit NWM2280996
- 17 Beargrass Ln NE
- 1754 NE Mesford Rd Unit 74
- Luna Plan at Liberty Bay Vista
- Rainier Plan at Liberty Bay Vista
- Bennett Plan at Liberty Bay Vista
- Bennett (Basement) Plan at Liberty Bay Vista
- Noah (Basement) Plan at Liberty Bay Vista
- Warren Plan at Liberty Bay Vista
- Raymond Plan at Liberty Bay Vista
- 1073 NE Rindall Ct
- 1080 NE Rindall Ct
- 18289 11th Ave NE
- 18267 11th Ave NE
- 1049 NE Rindall Ct
- 18315 11th Ave NE
- 1049 NE Rindal Ct
- 1040 NE Rindall Ct
- 18245 11th Ave NE
- 1068 NE Rindal Ct
- 1068 NE Rindall Ct
- 1082 NE Tollefson St
- 18337 11th Ave NE
- 18244 10th Ave NE
- 18217 11th Ave NE
- 1053 NE Rindall Ct
- 1010 NE Rindall Ct
- 18361 11th Ave NE
- 1020 NE Tollefson St
- 18290 11th Ave NE