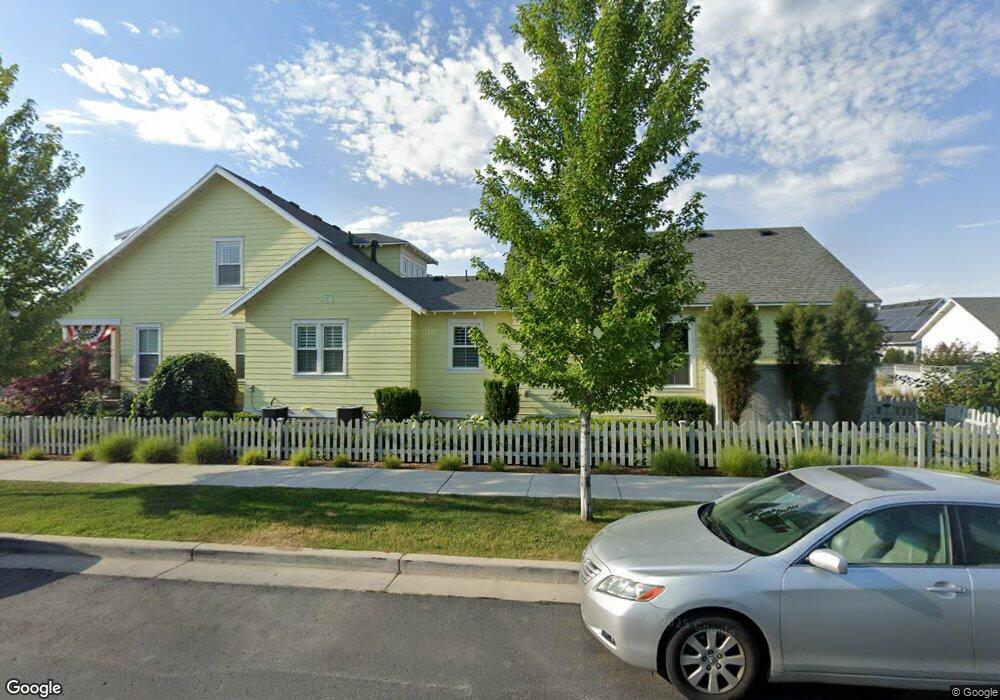
10763 S Felicity Ct Unit 10-128 South Jordan, UT 84095
Daybreak NeighborhoodEstimated Value: $811,000 - $1,246,000
1
Bed
4
Baths
3,641
Sq Ft
$290/Sq Ft
Est. Value
About This Home
This home is located at 10763 S Felicity Ct Unit 10-128, South Jordan, UT 84095 and is currently estimated at $1,055,734, approximately $289 per square foot. 10763 S Felicity Ct Unit 10-128 is a home located in Salt Lake County with nearby schools including Eastlake Elementary School, Mountain Creek Middle School, and Herriman High School.
Ownership History
Date
Name
Owned For
Owner Type
Purchase Details
Closed on
Oct 9, 2014
Sold by
Hancock Mark Ralph
Bought by
Hancock Mark Ralph and Hancock Debbie O
Current Estimated Value
Home Financials for this Owner
Home Financials are based on the most recent Mortgage that was taken out on this home.
Original Mortgage
$177,677
Outstanding Balance
$57,134
Interest Rate
3.22%
Mortgage Type
New Conventional
Estimated Equity
$998,600
Purchase Details
Closed on
May 8, 2014
Sold by
Daybreak Development Co
Bought by
Rainey Homes Inc
Home Financials for this Owner
Home Financials are based on the most recent Mortgage that was taken out on this home.
Original Mortgage
$2,000,000
Interest Rate
4.38%
Mortgage Type
Construction
Create a Home Valuation Report for This Property
The Home Valuation Report is an in-depth analysis detailing your home's value as well as a comparison with similar homes in the area
Home Values in the Area
Average Home Value in this Area
Purchase History
| Date | Buyer | Sale Price | Title Company |
|---|---|---|---|
| Hancock Mark Ralph | -- | Accommodation | |
| Hancock Mark Ralph | -- | Bonneville Superior Title | |
| Rainey Homes Inc | -- | First American Title |
Source: Public Records
Mortgage History
| Date | Status | Borrower | Loan Amount |
|---|---|---|---|
| Open | Hancock Mark Ralph | $177,677 | |
| Previous Owner | Rainey Homes Inc | $2,000,000 |
Source: Public Records
Tax History Compared to Growth
Tax History
| Year | Tax Paid | Tax Assessment Tax Assessment Total Assessment is a certain percentage of the fair market value that is determined by local assessors to be the total taxable value of land and additions on the property. | Land | Improvement |
|---|---|---|---|---|
| 2025 | $5,470 | $1,053,400 | $148,500 | $904,900 |
| 2024 | $5,470 | $1,038,500 | $144,100 | $894,400 |
| 2023 | $5,622 | $1,007,200 | $140,000 | $867,200 |
| 2022 | $5,756 | $1,010,600 | $137,200 | $873,400 |
| 2021 | $4,516 | $727,600 | $105,700 | $621,900 |
| 2020 | $4,205 | $635,000 | $99,600 | $535,400 |
| 2019 | $4,228 | $627,600 | $99,600 | $528,000 |
| 2018 | $3,879 | $582,700 | $98,100 | $484,600 |
| 2017 | $4,480 | $648,400 | $98,100 | $550,300 |
| 2016 | $3,856 | $528,900 | $98,100 | $430,800 |
| 2015 | $3,691 | $492,200 | $118,700 | $373,500 |
| 2014 | -- | $86,500 | $86,500 | $0 |
Source: Public Records
Map
Nearby Homes
- 4518 W Cave Run Ln
- 10924 Paddle Board Way
- 4652 W Isla Daybreak Rd Unit 128
- 10566 S Oquirrh Lake Rd
- 10991 Lake Island Dr Unit 311
- 10993 Lake Island Dr Unit 310
- 10934 Coralville Way
- 10843 S Lake Ave Unit 257
- Ashland Plan at Cascade Village - Augustine
- Avenel Plan at Cascade Village - Augustine
- Camden Plan at Cascade Village - Augustine
- Sonoma Plan at Cascade Village - Augustine
- 11037 S Lake Island Dr Unit 3-378
- 10762 S Beach Comber Way
- 11043 S Lake Island Dr Unit 3-377
- 10566 S Lake Ave
- 11048 S Paddle Board Way Unit 3-332
- 4821 W Dock St
- 11021 S Kestrel Rise Rd
- 11064 S Paddle Board Way
- 10769 S Felicity Ct Unit P1-127
- 10769 S Felicity Ct
- 10757 S Felicity Ct
- 10768 S Felicity Ct Unit 10-126
- 10768 S Rippling Bay Unit 4-133
- 10762 S Rippling Bay Unit 132
- 4617 W Watery Way
- 10758 S Felicity Ct
- 10754 S Rippling Bay Unit 3131
- 10754 S Rippling Bay Unit 131
- 10771 S Rippling Bay Unit 4-134
- 4639 W Watery Way
- 10761 S Rippling Bay Unit 136
- 10761 S Rippling Bay
- 10769 S Rippling Bay Unit 4E-135
- 10753 S Rippling Bay Unit 137
- 4622 W Watery Way Unit 124
- 10732 S Wistful Way
- 10733 S Wistful Way
- 10769 S Isthmus Place Unit 113