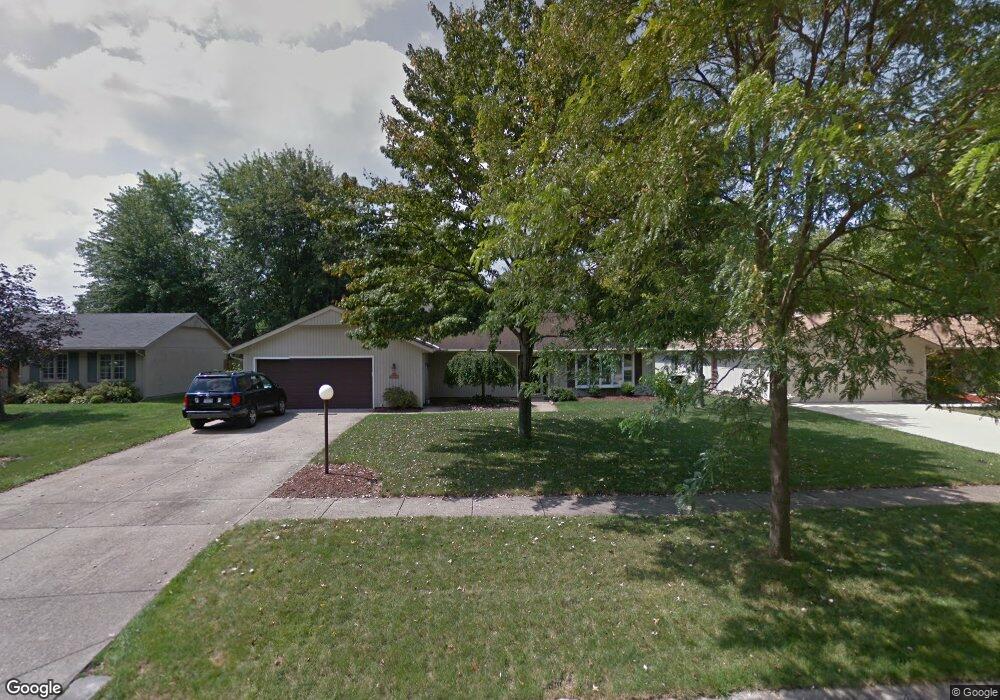
10764 Pebble Brook Ln Strongsville, OH 44149
Estimated Value: $386,000 - $411,000
5
Beds
3
Baths
2,671
Sq Ft
$149/Sq Ft
Est. Value
About This Home
This home is located at 10764 Pebble Brook Ln, Strongsville, OH 44149 and is currently estimated at $397,845, approximately $148 per square foot. 10764 Pebble Brook Ln is a home located in Cuyahoga County with nearby schools including Strongsville High School, St Mary School, and Sts Joseph & John Interparochial School.
Ownership History
Date
Name
Owned For
Owner Type
Purchase Details
Closed on
Jul 19, 2024
Sold by
Lelonis Donald A
Bought by
Pangersis Katherine M and Pangersis Mark A
Current Estimated Value
Purchase Details
Closed on
May 19, 2014
Sold by
Lelonis Donald A
Bought by
Pangersis Katherine M
Purchase Details
Closed on
May 23, 2012
Sold by
Lelonis Donald A and Pfeiler Sarah A
Bought by
Lelonis Donald A
Purchase Details
Closed on
Oct 17, 2009
Sold by
Lelonis Donald A
Bought by
Lelonis Donald A and Pfeiler Sarah A
Purchase Details
Closed on
May 9, 2008
Sold by
Estate Of Lelonis Jean M
Bought by
Lelonis Donald A
Purchase Details
Closed on
Aug 12, 1983
Sold by
Kijowski John R
Bought by
Lelonis Donald A
Purchase Details
Closed on
Jul 7, 1978
Bought by
Kijowski John R
Purchase Details
Closed on
Jan 1, 1977
Bought by
Bob Schmitt Homes Inc
Create a Home Valuation Report for This Property
The Home Valuation Report is an in-depth analysis detailing your home's value as well as a comparison with similar homes in the area
Home Values in the Area
Average Home Value in this Area
Purchase History
| Date | Buyer | Sale Price | Title Company |
|---|---|---|---|
| Pangersis Katherine M | -- | None Listed On Document | |
| Pangersis Katherine M | -- | None Available | |
| Lelonis Donald A | -- | None Available | |
| Lelonis Donald A | -- | None Available | |
| Lelonis Donald A | -- | None Available | |
| Lelonis Donald A | $88,900 | -- | |
| Kijowski John R | $74,900 | -- | |
| Bob Schmitt Homes Inc | -- | -- |
Source: Public Records
Tax History Compared to Growth
Tax History
| Year | Tax Paid | Tax Assessment Tax Assessment Total Assessment is a certain percentage of the fair market value that is determined by local assessors to be the total taxable value of land and additions on the property. | Land | Improvement |
|---|---|---|---|---|
| 2024 | $5,180 | $120,120 | $19,565 | $100,555 |
| 2023 | $4,997 | $88,970 | $17,080 | $71,890 |
| 2022 | $4,986 | $88,970 | $17,080 | $71,890 |
| 2021 | $4,947 | $88,970 | $17,080 | $71,890 |
| 2020 | $4,831 | $78,050 | $14,980 | $63,070 |
| 2019 | $4,689 | $223,000 | $42,800 | $180,200 |
| 2018 | $4,532 | $78,050 | $14,980 | $63,070 |
| 2017 | $4,317 | $73,820 | $13,370 | $60,450 |
| 2016 | $4,282 | $73,820 | $13,370 | $60,450 |
| 2015 | $4,808 | $73,820 | $13,370 | $60,450 |
| 2014 | $4,784 | $71,690 | $12,990 | $58,700 |
Source: Public Records
Map
Nearby Homes
- 10001 N Marks Rd
- 10800 Meadow Trail
- 10824 Watercress Rd
- 22300 Rock Creek Cir
- 10842 Fence Row Dr
- 9598 Pebble Brook Ln
- 0 Priem Rd
- 9829 Plum Brook Ln
- 11030 Southwind Ct
- 8746 Barton Dr
- 9384 N Marks Rd
- 10353 Oak Branch Trail
- 8902 Lincolnshire Blvd
- 21292 Creekside Dr
- 8981 Leatherleaf Dr
- 21176 Hickory Branch Trail
- 8896 Firethorne Dr
- 12515 Countryside Dr
- 8960 Leatherleaf Dr
- 21359 Briar Bush Ln
- 10768 Pebble Brook Ln
- 10760 Pebble Brook Ln
- 10772 Pebble Brook Ln
- 10767 Gate Post Rd
- 10771 Gate Post Rd
- 10763 Gate Post Rd
- 10743 Waterfall Rd
- 10759 Pebble Brook Ln
- 10761 Pebble Brook Ln
- 10775 Gate Post Rd
- 10747 Gate Post Rd
- 10747 Waterfall Rd
- 10776 Pebble Brook Ln
- 10765 Pebble Brook Ln
- 10744 Waterfall Rd
- 10751 Gate Post Rd
- 10779 Gate Post Rd
- 10769 Pebble Brook Ln
- 10755 Gate Post Rd
- 10780 Pebble Brook Ln