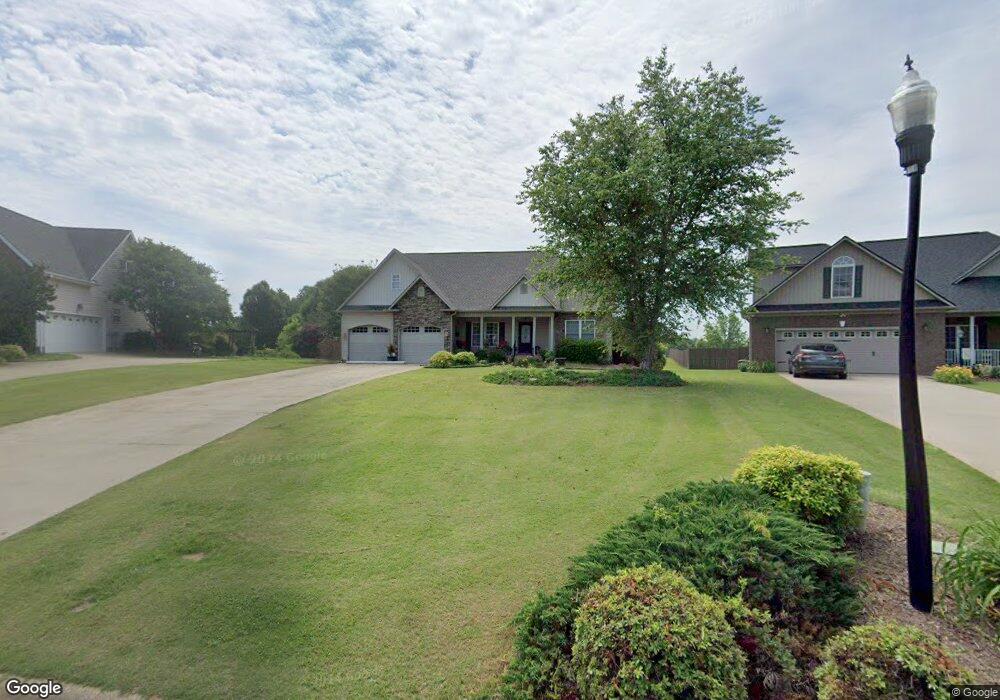
1077 Corie Crest Dr Boiling Springs, SC 29316
Estimated Value: $325,169 - $406,000
3
Beds
2
Baths
2,115
Sq Ft
$176/Sq Ft
Est. Value
About This Home
This home is located at 1077 Corie Crest Dr, Boiling Springs, SC 29316 and is currently estimated at $372,042, approximately $175 per square foot. 1077 Corie Crest Dr is a home located in Spartanburg County with nearby schools including Carlisle-Foster's Grove Elementary School, Rainbow Lake Middle School, and Boiling Springs High School.
Ownership History
Date
Name
Owned For
Owner Type
Purchase Details
Closed on
Dec 16, 2010
Sold by
Bishop Lisa C
Bought by
Bishop Lisa C and Bishop Tracy Ryan
Current Estimated Value
Purchase Details
Closed on
Jan 21, 2008
Sold by
Gould Christopher L and Gould Martha C
Bought by
Bishop Lisa C
Home Financials for this Owner
Home Financials are based on the most recent Mortgage that was taken out on this home.
Original Mortgage
$194,778
Interest Rate
6.04%
Mortgage Type
FHA
Purchase Details
Closed on
Feb 27, 2006
Sold by
Piedmont Construction Co Inc
Bought by
Gould Christopher L and Gould Martha C
Home Financials for this Owner
Home Financials are based on the most recent Mortgage that was taken out on this home.
Original Mortgage
$25,000
Interest Rate
6.05%
Mortgage Type
Credit Line Revolving
Create a Home Valuation Report for This Property
The Home Valuation Report is an in-depth analysis detailing your home's value as well as a comparison with similar homes in the area
Home Values in the Area
Average Home Value in this Area
Purchase History
| Date | Buyer | Sale Price | Title Company |
|---|---|---|---|
| Bishop Lisa C | -- | -- | |
| Bishop Lisa C | $202,000 | -- | |
| Gould Christopher L | $210,000 | None Available |
Source: Public Records
Mortgage History
| Date | Status | Borrower | Loan Amount |
|---|---|---|---|
| Previous Owner | Bishop Lisa C | $194,778 | |
| Previous Owner | Gould Christopher L | $25,000 | |
| Previous Owner | Gould Christopher L | $148,000 |
Source: Public Records
Tax History Compared to Growth
Tax History
| Year | Tax Paid | Tax Assessment Tax Assessment Total Assessment is a certain percentage of the fair market value that is determined by local assessors to be the total taxable value of land and additions on the property. | Land | Improvement |
|---|---|---|---|---|
| 2025 | $1,565 | $9,829 | $1,362 | $8,467 |
| 2024 | $1,565 | $9,829 | $1,362 | $8,467 |
| 2023 | $1,565 | $9,829 | $1,362 | $8,467 |
| 2022 | $1,398 | $8,547 | $1,031 | $7,516 |
| 2021 | $1,395 | $8,547 | $1,031 | $7,516 |
| 2020 | $1,375 | $8,547 | $1,031 | $7,516 |
| 2019 | $1,375 | $8,547 | $1,031 | $7,516 |
| 2018 | $1,341 | $8,547 | $1,031 | $7,516 |
| 2017 | $1,177 | $7,432 | $1,040 | $6,392 |
| 2016 | $1,185 | $7,432 | $1,040 | $6,392 |
| 2015 | $1,193 | $7,432 | $1,040 | $6,392 |
| 2014 | $1,177 | $7,432 | $1,040 | $6,392 |
Source: Public Records
Map
Nearby Homes
- 1073 Corie Crest Dr
- 9035 Germaine Ct
- 7085 Luna Mae Ct
- 5435 Parris Bridge Rd
- 5419 Parris Bridge Rd
- 575 Mountainview Rd
- 236 Summer Lady Ln
- 151 Summer Lady Ln
- 171 Aldrich Rd
- 331 Saddlers Run
- 608 Berry Rd
- 198 Blease Horton Rd
- 380 Saddlers Run
- 432 N Beryl Ln
- 509 Sedona Ct
- 1061 Paula Parris Rd Unit PRM 40
- 4943 Parris Bridge Rd
- 2017 Emily Margaret Rd
- 2017 Emily Margaret Rd Unit PRM28
- 1062 Paula Parris Rd Unit PRM 39
- 1081 Corie Crest Dr
- 1085 Corie Crest Dr
- 1069 Corie Crest Dr
- 1080 Corie Crest Dr
- 1089 Corie Crest Dr
- 1066 Corie Crest Dr
- 1065 Corie Crest Dr
- 162 Highland Ridge Trail
- 168 Highland Ridge Trail
- 1088 Corie Crest Dr
- 156 Highland Ridge Trail
- 1093 Corie Crest Dr
- 1061 Corie Crest Dr
- 1062 Corie Crest Dr
- 1092 Corie Crest Dr
- 215 Piper Ct
- 211 Piper Ct
- 1057 Corie Crest Dr
- 1058 Corie Crest Dr
- 142 Highland Ridge Trail