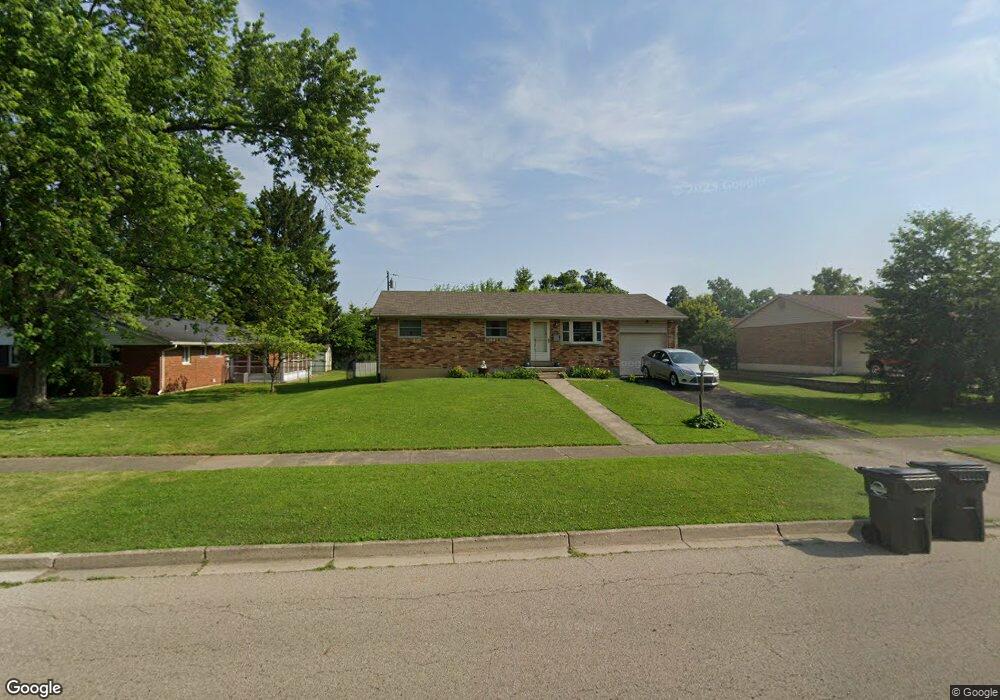
1077 Pool Ave Vandalia, OH 45377
Estimated Value: $189,843 - $216,000
3
Beds
3
Baths
1,036
Sq Ft
$198/Sq Ft
Est. Value
About This Home
This home is located at 1077 Pool Ave, Vandalia, OH 45377 and is currently estimated at $205,461, approximately $198 per square foot. 1077 Pool Ave is a home located in Montgomery County with nearby schools including Helke Elementary School, Morton Middle School, and Butler High School.
Ownership History
Date
Name
Owned For
Owner Type
Purchase Details
Closed on
Mar 15, 2013
Sold by
Simon Robert E
Bought by
Simon Pamela A
Current Estimated Value
Purchase Details
Closed on
Jun 28, 2001
Sold by
Keen Stella J
Bought by
Simon Robert E and Simon Pamela A
Home Financials for this Owner
Home Financials are based on the most recent Mortgage that was taken out on this home.
Original Mortgage
$90,000
Outstanding Balance
$34,784
Interest Rate
7.18%
Estimated Equity
$170,677
Purchase Details
Closed on
Jul 10, 1999
Sold by
Kraus Arnold E and Kraus Sandra L
Bought by
Keen Stella J
Home Financials for this Owner
Home Financials are based on the most recent Mortgage that was taken out on this home.
Original Mortgage
$105,113
Interest Rate
7.43%
Mortgage Type
FHA
Create a Home Valuation Report for This Property
The Home Valuation Report is an in-depth analysis detailing your home's value as well as a comparison with similar homes in the area
Home Values in the Area
Average Home Value in this Area
Purchase History
| Date | Buyer | Sale Price | Title Company |
|---|---|---|---|
| Simon Pamela A | -- | None Available | |
| Simon Robert E | $112,900 | -- | |
| Keen Stella J | $106,000 | -- |
Source: Public Records
Mortgage History
| Date | Status | Borrower | Loan Amount |
|---|---|---|---|
| Open | Simon Robert E | $90,000 | |
| Previous Owner | Keen Stella J | $105,113 |
Source: Public Records
Tax History Compared to Growth
Tax History
| Year | Tax Paid | Tax Assessment Tax Assessment Total Assessment is a certain percentage of the fair market value that is determined by local assessors to be the total taxable value of land and additions on the property. | Land | Improvement |
|---|---|---|---|---|
| 2024 | $2,708 | $51,790 | $12,200 | $39,590 |
| 2023 | $2,708 | $51,790 | $12,200 | $39,590 |
| 2022 | $2,428 | $37,530 | $8,840 | $28,690 |
| 2021 | $2,430 | $37,530 | $8,840 | $28,690 |
| 2020 | $2,425 | $37,530 | $8,840 | $28,690 |
| 2019 | $2,311 | $30,540 | $7,690 | $22,850 |
| 2018 | $2,158 | $30,540 | $7,690 | $22,850 |
| 2017 | $2,142 | $30,540 | $7,690 | $22,850 |
| 2016 | $2,146 | $30,080 | $7,690 | $22,390 |
| 2015 | $2,120 | $30,080 | $7,690 | $22,390 |
| 2014 | $2,120 | $30,080 | $7,690 | $22,390 |
| 2012 | -- | $34,280 | $8,540 | $25,740 |
Source: Public Records
Map
Nearby Homes
- 1018 Marcellus Dr
- 445 Pilot Point Unit 1-203
- 435 Pilot Point Unit 1-303
- 425 Pilot Point Unit 1-305
- 405 Pilot Point Unit 1-204
- 455 Pilot Point Unit 1-202
- 415 Pilot Point Unit 1-304
- 485 Pilot Point Unit 1-301
- 475 Pilot Point Unit 1-300
- 696 W Alkaline Springs Rd
- 626 W National Rd
- 465 Pilot Point Unit 1-302
- 1054 Wilhelmina Dr
- 545 Koch Ave
- 106 Grosbeck St
- 416 Attica St
- 246 Crest Hill Ave
- 8375 Peters Pike
- 1201 Greystone Cir
- 1515 Ash Ridge Ct