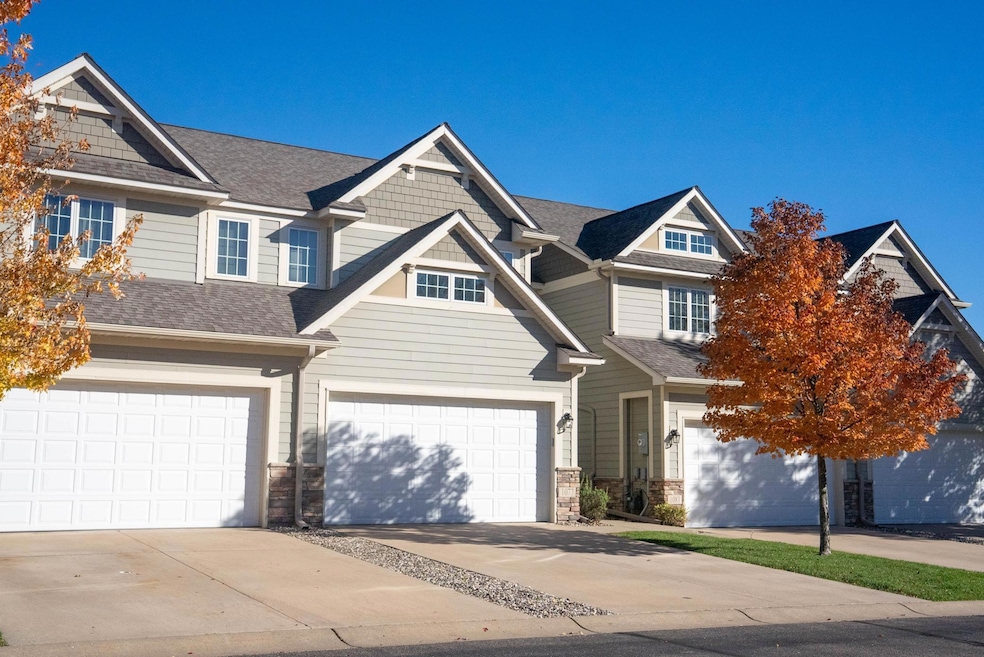
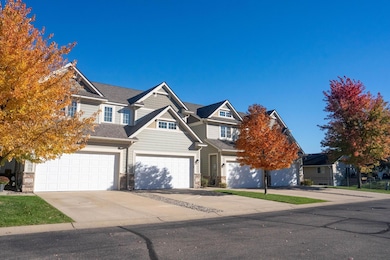
1077 Provence Ln Waconia, MN 55387
Estimated payment $2,502/month
Highlights
- Radiant Floor
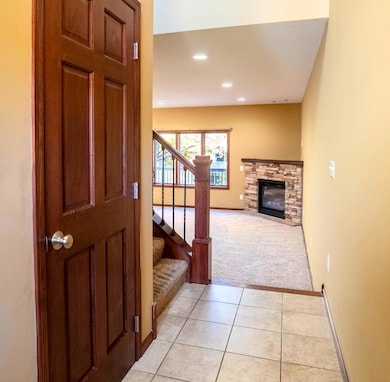
- 1 Fireplace
- Forced Air Heating and Cooling System
- Bayview Elementary School Rated A-
- 2 Car Attached Garage
- Water Softener is Owned
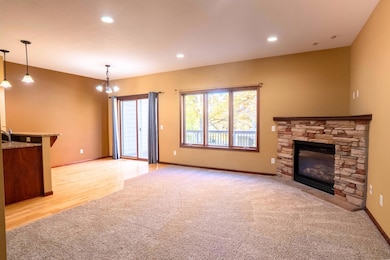
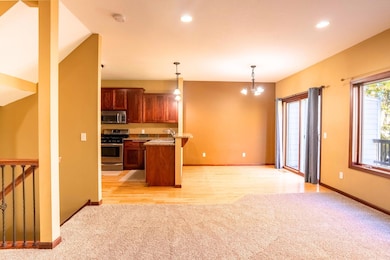
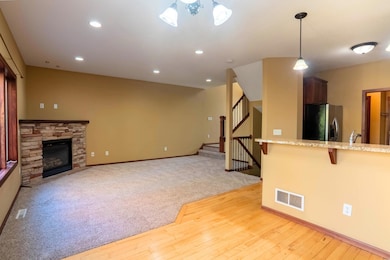
About This Home
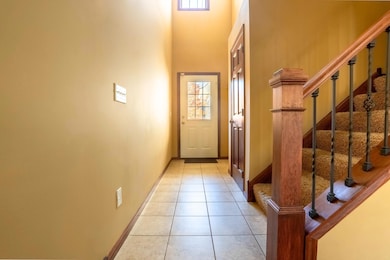
Welcome to the heart of Waconia. This stunning 2,404 square foot spacious residence has the perfect blend of comfort and charm, featuring four bedrooms and four bathrooms. As you step inside, you're greeted by a spacious open-concept living area bathed in natural light, creating a warm and inviting atmosphere. The modern kitchen features sleek stainless steel appliances, hardwood floors, and granite countertops, ideal for both everyday meals and entertaining guests. Head upstairs where you’ll find a loft along with three spacious bedrooms including the master suite. The lower level includes another bedroom and a 3⁄4 bathroom that has heated flooring. Outside, a private patio provides an ideal spot for morning coffee or evening gatherings. With convenient access to local amenities, parks, and schools, this townhome is a perfect sanctuary for those seeking both comfort and community. Don't miss the chance to make this delightful residence your new home!
Townhouse Details
Home Type
- Townhome
Est. Annual Taxes
- $3,828
Year Built
- Built in 2006
Lot Details
- 1,307 Sq Ft Lot
- Lot Dimensions are 70x24
HOA Fees
- $335 Monthly HOA Fees
Parking
- 2 Car Attached Garage
- Insulated Garage
- Garage Door Opener
Home Design
- Pitched Roof
Interior Spaces
- 2-Story Property
- 1 Fireplace
- Radiant Floor
Kitchen
- Range
- Microwave
- Dishwasher
Bedrooms and Bathrooms
- 4 Bedrooms
Laundry
- Dryer
- Washer
Finished Basement
- Walk-Out Basement
- Basement Fills Entire Space Under The House
- Sump Pump
- Drain
Utilities
- Forced Air Heating and Cooling System
- Water Softener is Owned
Community Details
- Association fees include ground maintenance
- Provence Town Homes Association, Phone Number (612) 810-7471
- Provence Town Homes Subdivision
Listing and Financial Details
- Assessor Parcel Number 753820080
Map
Home Values in the Area
Average Home Value in this Area
Tax History
| Year | Tax Paid | Tax Assessment Tax Assessment Total Assessment is a certain percentage of the fair market value that is determined by local assessors to be the total taxable value of land and additions on the property. | Land | Improvement |
|---|---|---|---|---|
| 2025 | $3,848 | $323,500 | $60,000 | $263,500 |
| 2024 | $3,828 | $318,700 | $50,000 | $268,700 |
| 2023 | $4,392 | $320,200 | $50,000 | $270,200 |
| 2022 | $4,020 | $372,100 | $48,400 | $323,700 |
| 2021 | $3,876 | $282,100 | $39,600 | $242,500 |
| 2020 | $3,682 | $277,700 | $39,600 | $238,100 |
| 2019 | $3,506 | $248,800 | $37,700 | $211,100 |
| 2018 | $3,486 | $248,800 | $37,700 | $211,100 |
| 2017 | $2,980 | $247,600 | $34,300 | $213,300 |
| 2016 | $3,110 | $222,000 | $0 | $0 |
| 2015 | $2,592 | $210,300 | $0 | $0 |
| 2014 | $2,592 | $170,300 | $0 | $0 |
Property History
| Date | Event | Price | List to Sale | Price per Sq Ft |
|---|---|---|---|---|
| 11/10/2025 11/10/25 | For Sale | $349,999 | -- | $146 / Sq Ft |
Purchase History
| Date | Type | Sale Price | Title Company |
|---|---|---|---|
| Warranty Deed | $245,000 | Trademarl Title Services Inc | |
| Warranty Deed | $224,900 | Tradition Title | |
| Foreclosure Deed | $210,900 | -- |
Mortgage History
| Date | Status | Loan Amount | Loan Type |
|---|---|---|---|
| Open | $119,000 | New Conventional | |
| Previous Owner | $232,321 | VA | |
| Closed | $0 | Land Contract Argmt. Of Sale |
Source: NorthstarMLS
MLS Number: 6813087
APN: 75.3820080
Disclaimer: Certain information contained herein is derived from information provided by parties other than Homes.com. All information provided is deemed reliable, but is not guaranteed to be accurate and should be independently verified.
![]() Based on information submitted to the MLS GRID. All data is obtained from various sources and may not have been verified by broker or MLS GRID. Supplied Open House Information is subject to change without notice. All information should be independently reviewed and verified for accuracy. Properties may or may not be listed by the office/agent presenting the information. Some IDX listings have been excluded from this website.
Based on information submitted to the MLS GRID. All data is obtained from various sources and may not have been verified by broker or MLS GRID. Supplied Open House Information is subject to change without notice. All information should be independently reviewed and verified for accuracy. Properties may or may not be listed by the office/agent presenting the information. Some IDX listings have been excluded from this website.
The Digital Millennium Copyright Act of 1998, 17 U.S.C. § 512 (the “DMCA”) provides recourse for copyright owners who believe that material appearing on the Internet infringes their rights under U.S. copyright law. If you believe in good faith that any content or material made available in connection with our website or services infringes your copyright, you (or your agent) may send us a notice requesting that the content or material be removed, or access to it blocked.
Notices must be sent in writing by email to DMCAnotice@MLSGrid.com.
The DMCA requires that your notice of alleged copyright infringement include the following information:
(1) description of the copyrighted work that is the subject of claimed infringement;
(2) description of the alleged infringing content and information sufficient to permit us to locate the content;
(3) contact information for you, including your address, telephone number and email address;
(4) a statement by you that you have a good faith belief that the content in the manner complained of is not authorized by the copyright owner, or its agent, or by the operation of any law;
(5) a statement by you, signed under penalty of perjury, that the information in the notification is accurate and that you have the authority to enforce the copyrights that are claimed to be infringed; and
(6) a physical or electronic signature of the copyright owner or a person authorized to act on the copyright owner’s behalf. Failure to include all of the above information may result in the delay of the processing of your complaint.
- 1024 Oak Ave
- 203 Snowdrop Trail
- 201 Snowdrop Trail
- 157 Snowdrop Trail
- 155 Snowdrop Trail
- 811 Foxglove Terrace
- The Henry Plan at The Fields of Waconia - Tradition
- The Holcombe Plan at The Fields of Waconia - Express Select
- The Whitney Plan at The Fields of Waconia - Tradition
- The Clifton II Plan at The Fields of Waconia - Tradition
- The Jordan Plan at The Fields of Waconia - Tradition
- 526 Goldenrod Trail
- The Eldorado Plan at The Fields of Waconia - Express Select
- The Hudson Plan at The Fields of Waconia - Express Select
- 528 Goldenrod Trail
- The Harmony Plan at The Fields of Waconia - Express Select
- The Elm Plan at The Fields of Waconia - Express Select
- The Adams II Plan at The Fields of Waconia - Tradition
- The Henley Plan at The Fields of Waconia - Express Select
- The Jameson Plan at The Fields of Waconia - Tradition
- 800 Meadow Lake Place
- 601 Industrial Blvd W
- 334 W 5th St
- 241 Wildhurst Rd
- 13XX Peitz Ave
- 301 W 2nd St
- 416 S Olive St
- 233 S Olive St
- 32 E Lake St
- 5395 Robinwood Ct
- 4701 Kings Point Rd
- 6900 Crosby Ct
- 106 2nd Ave SE
- 2000 Stieger Lake Ln
- 202 Lincoln St Unit 5
- 7980 Rose St
- 1699 Steiger Lake Ln
- 1627 Fox Hunt Way
- 5539 Welter Way
- 1519 82nd St
