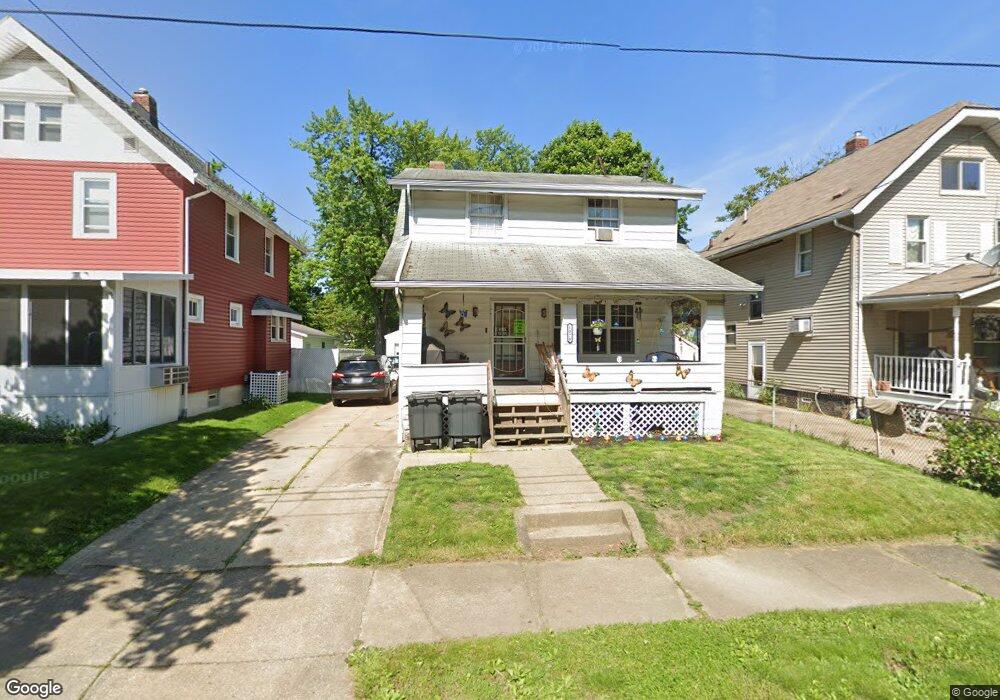
1078 Herberich Ave Akron, OH 44301
South Akron NeighborhoodEstimated Value: $53,000 - $99,000
3
Beds
1
Bath
1,192
Sq Ft
$68/Sq Ft
Est. Value
About This Home
This home is located at 1078 Herberich Ave, Akron, OH 44301 and is currently estimated at $80,924, approximately $67 per square foot. 1078 Herberich Ave is a home located in Summit County with nearby schools including Glover Community Learning Center, Kenmore Garfield Community Learning Center, and Main Preparatory Academy.
Ownership History
Date
Name
Owned For
Owner Type
Purchase Details
Closed on
Jan 28, 2019
Sold by
Pettiford Lacey and Pettiford Lacey Lamont
Bought by
Kll Holdings Llc
Current Estimated Value
Purchase Details
Closed on
Oct 25, 2017
Sold by
Zrinyi Eugene G
Bought by
Pettiford Lacey L
Purchase Details
Closed on
Jan 25, 2006
Sold by
Dlj Mortgage Capital Inc
Bought by
Zrinyi Eugene G
Purchase Details
Closed on
Dec 30, 2005
Sold by
Thurman Janice
Bought by
Dlj Mortgage Capital Inc
Purchase Details
Closed on
Dec 6, 2000
Sold by
Aronhalt Letha D
Bought by
Thurman Janice L
Home Financials for this Owner
Home Financials are based on the most recent Mortgage that was taken out on this home.
Original Mortgage
$68,200
Interest Rate
7.8%
Create a Home Valuation Report for This Property
The Home Valuation Report is an in-depth analysis detailing your home's value as well as a comparison with similar homes in the area
Home Values in the Area
Average Home Value in this Area
Purchase History
| Date | Buyer | Sale Price | Title Company |
|---|---|---|---|
| Kll Holdings Llc | -- | None Available | |
| Pettiford Lacey L | $11,270 | None Available | |
| Zrinyi Eugene G | $55,500 | Resource Title Agency Inc | |
| Dlj Mortgage Capital Inc | $54,000 | Resource Title Agency Inc | |
| Thurman Janice L | $70,400 | Midland Commerce Group |
Source: Public Records
Mortgage History
| Date | Status | Borrower | Loan Amount |
|---|---|---|---|
| Previous Owner | Thurman Janice L | $68,200 |
Source: Public Records
Tax History Compared to Growth
Tax History
| Year | Tax Paid | Tax Assessment Tax Assessment Total Assessment is a certain percentage of the fair market value that is determined by local assessors to be the total taxable value of land and additions on the property. | Land | Improvement |
|---|---|---|---|---|
| 2025 | $5,638 | $20,374 | $4,347 | $16,027 |
| 2024 | $1,204 | $20,374 | $4,347 | $16,027 |
| 2023 | $5,638 | $20,374 | $4,347 | $16,027 |
| 2022 | $1,039 | $13,563 | $2,804 | $10,759 |
| 2021 | $1,040 | $13,563 | $2,804 | $10,759 |
| 2020 | $1,002 | $13,560 | $2,800 | $10,760 |
| 2019 | $1,364 | $18,260 | $5,300 | $12,960 |
| 2018 | $1,346 | $18,260 | $5,300 | $12,960 |
| 2017 | $1,424 | $18,260 | $5,300 | $12,960 |
| 2016 | $1,425 | $18,540 | $5,300 | $13,240 |
| 2015 | $1,424 | $18,540 | $5,300 | $13,240 |
| 2014 | $1,413 | $18,540 | $5,300 | $13,240 |
| 2013 | $1,480 | $19,890 | $5,300 | $14,590 |
Source: Public Records
Map
Nearby Homes
- 568 Stanton Ave
- 1094 Dietz Ave
- 1102 Dietz Ave
- 1051 Brown St
- 979 Neptune Ave
- 565 Eva Ave
- 1043 Coventry St
- 1025 Coventry St
- 610 Morgan Ave
- 970 Allendale Ave
- 450 Stanton Ave
- 559 Morgan Ave
- 1217 Brown St
- 1218 Dietz Ave
- 1012 Kling St
- 1198 Burkhardt Ave
- 1100 Beardsley St
- 986 Hammel St
- 1230 Herberich Ave
- 1243 Herberich Ave
- 1082 Herberich Ave
- 1074 Herberich Ave
- 1086 Herberich Ave
- 1070 Herberich Ave
- 1090 Herberich Ave
- 1081 Dietz Ave
- 1085 Dietz Ave
- 1077 Dietz Ave
- 1066 Herberich Ave
- 564 Stanton Ave
- 1089 Dietz Ave
- 1071 Dietz Ave
- 1077 Herberich Ave
- 1081 Herberich Ave
- 1069 Herberich Ave
- 1094 Herberich Ave
- 1093 Dietz Ave
- 1085 Herberich Ave
- 1085 Herberich Ave
- 1067 Dietz Ave