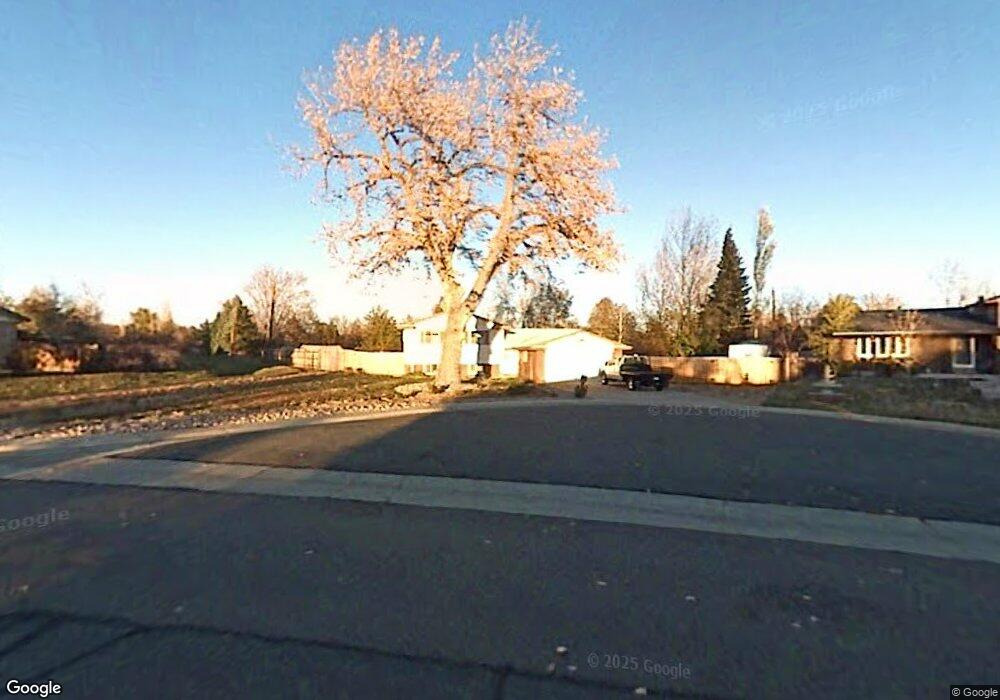
1078 S Johnson Way Lakewood, CO 80226
Belmar Park NeighborhoodEstimated Value: $614,000 - $631,287
3
Beds
3
Baths
2,054
Sq Ft
$302/Sq Ft
Est. Value
About This Home
This home is located at 1078 S Johnson Way, Lakewood, CO 80226 and is currently estimated at $620,072, approximately $301 per square foot. 1078 S Johnson Way is a home located in Jefferson County with nearby schools including Belmar School of Integrated Arts, Creighton Middle School, and Lakewood High School.
Ownership History
Date
Name
Owned For
Owner Type
Purchase Details
Closed on
Oct 8, 2020
Sold by
Magley Robert Wayne and Magley Erin Marie
Bought by
Nash Michael R and Nash Marlys A
Current Estimated Value
Home Financials for this Owner
Home Financials are based on the most recent Mortgage that was taken out on this home.
Original Mortgage
$357,500
Outstanding Balance
$317,398
Interest Rate
2.8%
Mortgage Type
New Conventional
Estimated Equity
$302,674
Purchase Details
Closed on
Jul 21, 2008
Sold by
Hart Alan S and Hart Cheryl L
Bought by
Magley Robert Wayne and Magley Erin Marie
Home Financials for this Owner
Home Financials are based on the most recent Mortgage that was taken out on this home.
Original Mortgage
$265,253
Interest Rate
6.6%
Mortgage Type
FHA
Purchase Details
Closed on
Oct 15, 2002
Sold by
Gerbrandt Kenneth L
Bought by
Hart Alan S and Hart Cheryl L
Home Financials for this Owner
Home Financials are based on the most recent Mortgage that was taken out on this home.
Original Mortgage
$174,400
Interest Rate
6.09%
Create a Home Valuation Report for This Property
The Home Valuation Report is an in-depth analysis detailing your home's value as well as a comparison with similar homes in the area
Home Values in the Area
Average Home Value in this Area
Purchase History
| Date | Buyer | Sale Price | Title Company |
|---|---|---|---|
| Nash Michael R | $450,000 | First American | |
| Magley Robert Wayne | $269,000 | Guardian Title | |
| Hart Alan S | $218,000 | -- |
Source: Public Records
Mortgage History
| Date | Status | Borrower | Loan Amount |
|---|---|---|---|
| Open | Nash Michael R | $357,500 | |
| Previous Owner | Magley Robert Wayne | $265,253 | |
| Previous Owner | Hart Alan S | $174,400 |
Source: Public Records
Tax History Compared to Growth
Tax History
| Year | Tax Paid | Tax Assessment Tax Assessment Total Assessment is a certain percentage of the fair market value that is determined by local assessors to be the total taxable value of land and additions on the property. | Land | Improvement |
|---|---|---|---|---|
| 2024 | $3,702 | $41,054 | $21,426 | $19,628 |
| 2023 | $3,702 | $41,054 | $21,426 | $19,628 |
| 2022 | $2,970 | $32,194 | $15,000 | $17,194 |
| 2021 | $2,931 | $32,222 | $15,432 | $16,790 |
| 2020 | $2,707 | $29,891 | $14,944 | $14,947 |
| 2019 | $2,672 | $29,891 | $14,944 | $14,947 |
| 2018 | $2,374 | $25,685 | $11,330 | $14,355 |
| 2017 | $2,086 | $25,685 | $11,330 | $14,355 |
| 2016 | $2,156 | $24,770 | $8,428 | $16,342 |
| 2015 | $2,018 | $24,770 | $8,428 | $16,342 |
| 2014 | $2,018 | $21,236 | $7,441 | $13,795 |
Source: Public Records
Map
Nearby Homes
- 987 S Johnson St
- 1092 S Iris St
- 9737 W Arizona Ave
- 9625 W Kentucky Dr
- 1272 S Jellison St
- 932 S Miller St
- 995 S Miller St Unit 101
- 1075 S Garrison St Unit 203
- 894 S Nelson Way
- 10353 W Arkansas Dr
- 10529 W Exposition Dr
- 842 S Newcombe Way
- 1227 S Flower Cir Unit A
- 1223 S Flower Cir Unit A
- 957 S Owens Ct
- 10473 W Arkansas Dr
- 1157 S Owens Ct
- 1157 S Everett St
- 1060 S Estes Ct
- 10943 W Exposition Place
- 1088 S Johnson Way
- 1077 S Johnson St
- 1057 S Johnson St
- 1038 S Johnson Way
- 1087 S Johnson St
- 1047 S Johnson St
- 1028 S Johnson Way
- 9981 W Mississippi Ave
- 1089 S Johnson Way
- 1018 S Johnson Way
- 9931 W Mississippi Ave
- 1037 S Johnson St
- 1079 S Johnson Way
- 1008 S Johnson Way
- 1099 S Johnson Way
- 1076 S Johnson St
- 1056 S Johnson St
- 1069 S Johnson Way
- 1086 S Johnson St
- 1027 S Johnson St