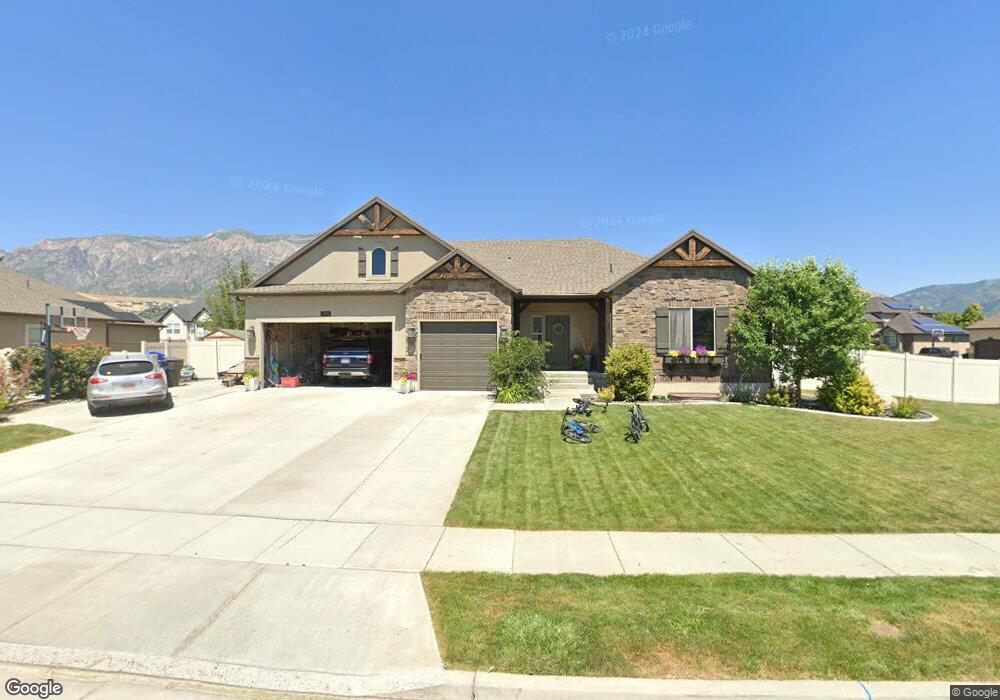
1078 W 3050 N Pleasant View, UT 84414
Estimated Value: $733,000 - $823,133
3
Beds
2
Baths
4,336
Sq Ft
$182/Sq Ft
Est. Value
About This Home
This home is located at 1078 W 3050 N, Pleasant View, UT 84414 and is currently estimated at $790,533, approximately $182 per square foot. 1078 W 3050 N is a home located in Weber County with nearby schools including Orion Junior High School, Weber High School, and Maria Montessori Academy.
Ownership History
Date
Name
Owned For
Owner Type
Purchase Details
Closed on
Aug 4, 2015
Sold by
Widener Jeffrey F
Bought by
Keyes Lynn R and Keyes Rachel
Current Estimated Value
Home Financials for this Owner
Home Financials are based on the most recent Mortgage that was taken out on this home.
Original Mortgage
$164,800
Outstanding Balance
$129,394
Interest Rate
3.98%
Mortgage Type
New Conventional
Estimated Equity
$661,139
Purchase Details
Closed on
Oct 11, 2010
Sold by
Rainey Homes Inc
Bought by
Widener Jeffrey F
Home Financials for this Owner
Home Financials are based on the most recent Mortgage that was taken out on this home.
Original Mortgage
$214,152
Interest Rate
4.31%
Mortgage Type
New Conventional
Purchase Details
Closed on
Jun 30, 2010
Sold by
Jmr Holdings Llc
Bought by
Rainey Homes Inc
Home Financials for this Owner
Home Financials are based on the most recent Mortgage that was taken out on this home.
Original Mortgage
$231,648
Interest Rate
4.79%
Mortgage Type
Construction
Create a Home Valuation Report for This Property
The Home Valuation Report is an in-depth analysis detailing your home's value as well as a comparison with similar homes in the area
Home Values in the Area
Average Home Value in this Area
Purchase History
| Date | Buyer | Sale Price | Title Company |
|---|---|---|---|
| Keyes Lynn R | -- | Mountain View Title Ogden | |
| Widener Jeffrey F | -- | Bonneville Superior Title Co | |
| Rainey Homes Inc | -- | Bonneville Superior Title Co |
Source: Public Records
Mortgage History
| Date | Status | Borrower | Loan Amount |
|---|---|---|---|
| Open | Keyes Lynn R | $164,800 | |
| Previous Owner | Widener Jeffrey F | $214,152 | |
| Previous Owner | Rainey Homes Inc | $231,648 |
Source: Public Records
Tax History Compared to Growth
Tax History
| Year | Tax Paid | Tax Assessment Tax Assessment Total Assessment is a certain percentage of the fair market value that is determined by local assessors to be the total taxable value of land and additions on the property. | Land | Improvement |
|---|---|---|---|---|
| 2025 | $4,896 | $784,845 | $221,286 | $563,559 |
| 2024 | $4,495 | $396,549 | $121,707 | $274,842 |
| 2023 | $3,918 | $344,850 | $121,536 | $223,314 |
| 2022 | $3,951 | $356,950 | $110,465 | $246,485 |
| 2021 | $3,322 | $505,000 | $135,729 | $369,271 |
| 2020 | $3,222 | $453,000 | $125,582 | $327,418 |
| 2019 | $3,051 | $408,000 | $120,454 | $287,546 |
| 2018 | $2,958 | $379,000 | $90,506 | $288,494 |
| 2017 | $2,920 | $354,000 | $90,506 | $263,494 |
| 2016 | $2,655 | $174,592 | $44,539 | $130,053 |
| 2015 | $2,404 | $155,895 | $47,352 | $108,543 |
| 2014 | $2,428 | $155,174 | $39,087 | $116,087 |
Source: Public Records
Map
Nearby Homes
- 3414 N 1160 W Unit 214-R
- 3055 N 1160 W
- 1023 W 3350 N
- 2750 N Parkland Blvd E Unit 16
- 2941 Highway 89 Unit 615
- 3011 N 1000 W
- 1012 W 3550 N
- 0 W Pleasant View Dr
- 1616 W 3125 N Unit 7
- 1621 W 3125 N Unit 4
- 1629 W 3125 N Unit 5
- 1700 W 2700 N Unit 10
- 1700 W 2700 N Unit 112
- 1700 W 2700 N Unit 110
- 1700 W 2700 N Unit 37
- 1700 W 2700 N Unit 84
- 1700 W 2700 N Unit 36
- 1700 W 2700 N Unit 110
- 1700 W 2700 N
- 600 W 2700 N
- 1080 W 3050 N
- 3071 N 1075 W
- 3071 N 1075 W Unit 70
- 1079 W 3050 N
- 1079 W 3050 N Unit 50
- 3062 N 1075 W
- 3062 N 1075 W Unit 45
- 1077 W 3050 N
- 1077 W 3050 N Unit 49
- 1081 W 3050 N
- 1081 W 3050 N Unit 51
- 1082 W 3050 N
- 1082 W 3050 N Unit 67
- 3087 N 1075 W
- 3087 N 1075 W Unit 71
- 3054 N 1075 W
- 3054 N 1075 W Unit 45
- 3054 N 1075 W Unit 46
- 3072 N 1075 W
- 3072 N 1075 W Unit 44