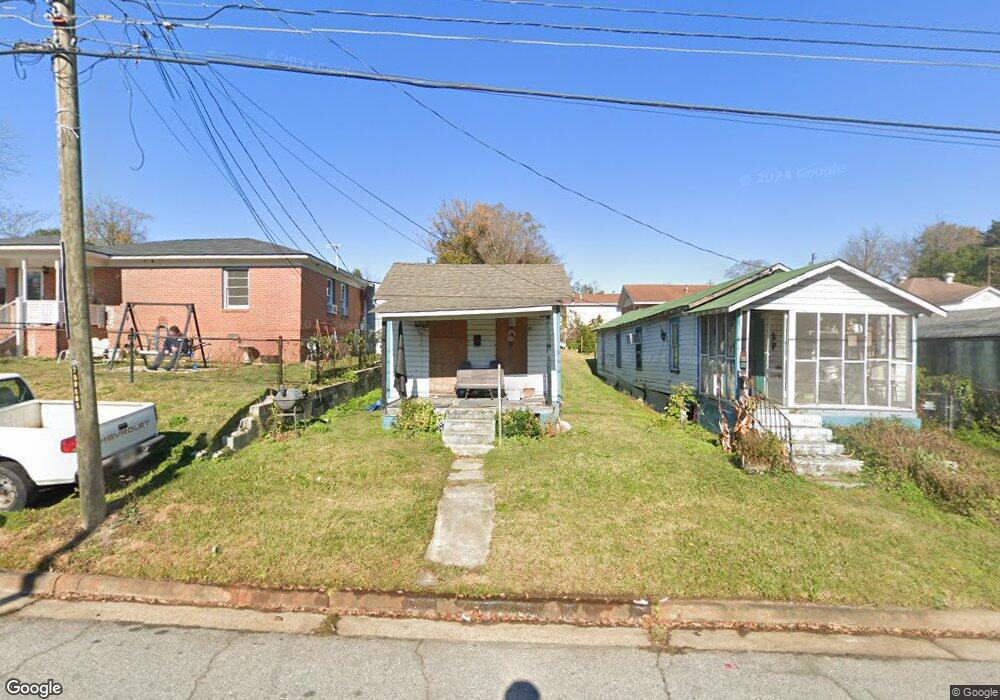
1079 43rd St Columbus, GA 31904
Columbus Tech-Bealwood NeighborhoodEstimated Value: $34,000 - $68,000
1
Bed
2
Baths
504
Sq Ft
$105/Sq Ft
Est. Value
About This Home
This home is located at 1079 43rd St, Columbus, GA 31904 and is currently estimated at $52,689, approximately $104 per square foot. 1079 43rd St is a home located in Muscogee County with nearby schools including Johnson Elementary School, Arnold Middle School, and Jordan Vocational High School.
Ownership History
Date
Name
Owned For
Owner Type
Purchase Details
Closed on
May 15, 2013
Sold by
Lumpkin Joanne
Bought by
Wicklund Willard
Current Estimated Value
Create a Home Valuation Report for This Property
The Home Valuation Report is an in-depth analysis detailing your home's value as well as a comparison with similar homes in the area
Home Values in the Area
Average Home Value in this Area
Purchase History
| Date | Buyer | Sale Price | Title Company |
|---|---|---|---|
| Wicklund Willard | -- | -- | |
| Richardson Janice F | -- | -- |
Source: Public Records
Tax History Compared to Growth
Tax History
| Year | Tax Paid | Tax Assessment Tax Assessment Total Assessment is a certain percentage of the fair market value that is determined by local assessors to be the total taxable value of land and additions on the property. | Land | Improvement |
|---|---|---|---|---|
| 2025 | $624 | $15,932 | $9,060 | $6,872 |
| 2024 | $624 | $15,932 | $9,060 | $6,872 |
| 2023 | $397 | $13,640 | $9,060 | $4,580 |
| 2022 | $397 | $9,720 | $6,340 | $3,380 |
| 2021 | $129 | $7,880 | $6,340 | $1,540 |
| 2020 | $322 | $7,880 | $6,340 | $1,540 |
| 2019 | $323 | $7,880 | $6,340 | $1,540 |
| 2018 | $323 | $7,880 | $6,340 | $1,540 |
| 2017 | $349 | $7,880 | $6,340 | $1,540 |
| 2016 | $99 | $2,400 | $550 | $1,850 |
| 2015 | $40 | $2,400 | $550 | $1,850 |
| 2014 | $40 | $2,400 | $550 | $1,850 |
| 2013 | -- | $2,400 | $550 | $1,850 |
Source: Public Records
Map
Nearby Homes