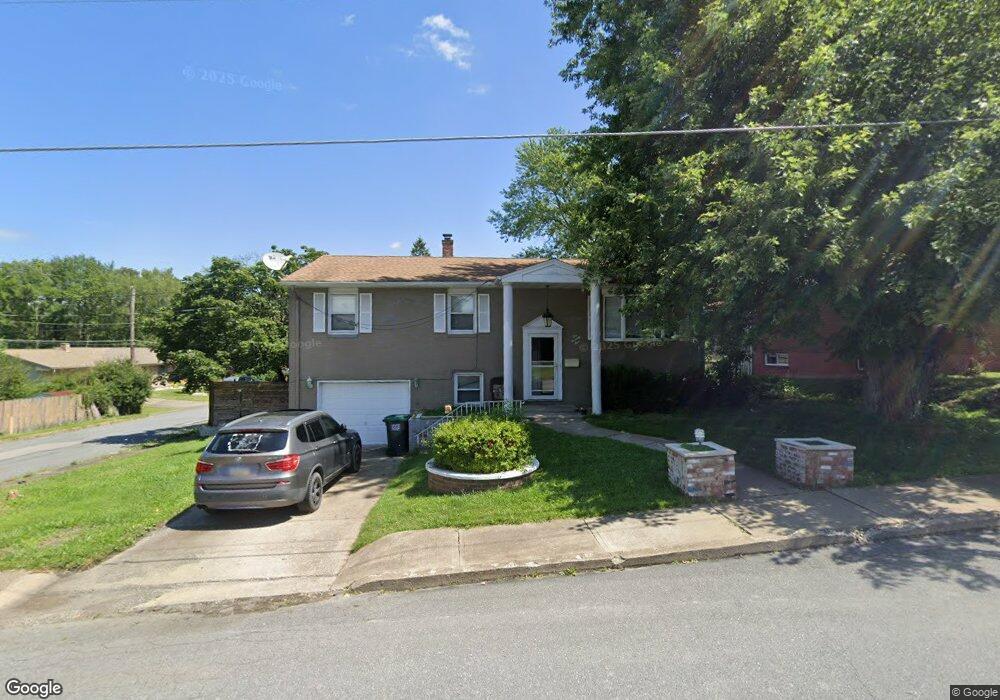
1079 Alter St Hazleton, PA 18202
Estimated Value: $226,196 - $290,000
Studio
--
Bath
1,764
Sq Ft
$145/Sq Ft
Est. Value
About This Home
This home is located at 1079 Alter St, Hazleton, PA 18202 and is currently estimated at $255,299, approximately $144 per square foot. 1079 Alter St is a home located in Luzerne County with nearby schools including Hazleton Area High School, Immanuel Christian School, and Bishop Hafey Junior/Senior High School.
Ownership History
Date
Name
Owned For
Owner Type
Purchase Details
Closed on
Oct 30, 2009
Sold by
Fannie Mae
Bought by
Vazquez Victoria and Vazquez Angel R
Current Estimated Value
Home Financials for this Owner
Home Financials are based on the most recent Mortgage that was taken out on this home.
Original Mortgage
$83,460
Outstanding Balance
$52,760
Interest Rate
4.86%
Mortgage Type
FHA
Estimated Equity
$202,539
Purchase Details
Closed on
Jun 10, 2009
Sold by
Bielskie Walter L and Bielskie Bernadine L
Bought by
Federal National Mortgage Association
Create a Home Valuation Report for This Property
The Home Valuation Report is an in-depth analysis detailing your home's value as well as a comparison with similar homes in the area
Home Values in the Area
Average Home Value in this Area
Purchase History
| Date | Buyer | Sale Price | Title Company |
|---|---|---|---|
| Vazquez Victoria | $85,000 | None Available | |
| Federal National Mortgage Association | $1,926 | None Available |
Source: Public Records
Mortgage History
| Date | Status | Borrower | Loan Amount |
|---|---|---|---|
| Open | Vazquez Victoria | $83,460 |
Source: Public Records
Tax History
| Year | Tax Paid | Tax Assessment Tax Assessment Total Assessment is a certain percentage of the fair market value that is determined by local assessors to be the total taxable value of land and additions on the property. | Land | Improvement |
|---|---|---|---|---|
| 2026 | $3,591 | $168,700 | $33,200 | $135,500 |
| 2025 | $3,432 | $168,700 | $33,200 | $135,500 |
| 2024 | $3,292 | $168,700 | $33,200 | $135,500 |
| 2023 | $3,227 | $168,700 | $33,200 | $135,500 |
| 2022 | $3,196 | $168,700 | $33,200 | $135,500 |
| 2021 | $3,098 | $168,700 | $33,200 | $135,500 |
| 2020 | $3,043 | $168,700 | $33,200 | $135,500 |
| 2019 | $2,915 | $168,700 | $33,200 | $135,500 |
| 2018 | $2,805 | $168,700 | $33,200 | $135,500 |
| 2017 | $2,744 | $168,700 | $33,200 | $135,500 |
| 2016 | -- | $168,700 | $33,200 | $135,500 |
| 2015 | $2,165 | $168,700 | $33,200 | $135,500 |
| 2014 | $2,165 | $168,700 | $33,200 | $135,500 |
Source: Public Records
Map
Nearby Homes
- 1087 Lafayette Ct
- 0 Church Unit PALU2002778
- 897 N Vine St
- 846 N Vine St
- 829 W 21st St
- 397 W 30th St
- 769 N Locust St
- 239 E 23rd St
- 991 Seybert St
- 911 Seybert St
- 756 Seybert St
- 403 W 7th St
- 14 W 4th St
- 60 E Jefferson Ave
- 127 W Diamond Ave
- 187 N Church St
- ER.126 W Aspen St
- 118 E Green St
- 1 W Diamond Ave
- TBD E Venisa Dr
Your Personal Tour Guide
Ask me questions while you tour the home.