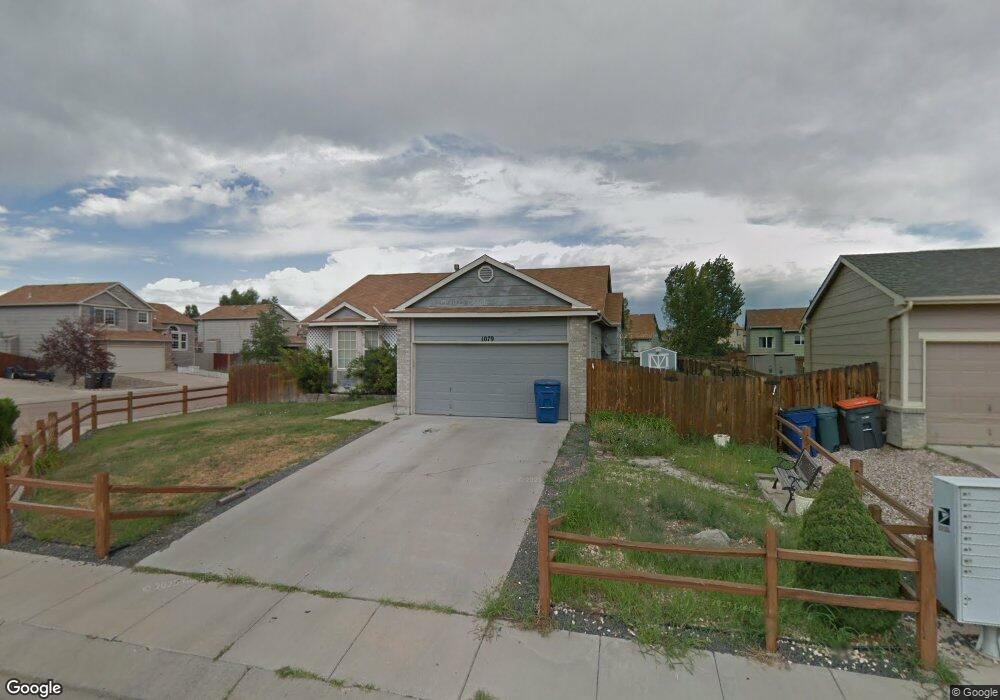
1079 Clogger Ln Unit FOU Fountain, CO 80817
Central Fountain Valley NeighborhoodEstimated Value: $397,000 - $449,000
6
Beds
3
Baths
1,313
Sq Ft
$321/Sq Ft
Est. Value
About This Home
This home is located at 1079 Clogger Ln Unit FOU, Fountain, CO 80817 and is currently estimated at $421,596, approximately $321 per square foot. 1079 Clogger Ln Unit FOU is a home located in El Paso County with nearby schools including Jordahl Elementary School, Fountain Middle School, and Fountain-Fort Carson High School.
Ownership History
Date
Name
Owned For
Owner Type
Purchase Details
Closed on
Jun 5, 2017
Sold by
Sawyers Billy J
Bought by
Hibbert Christopher and Hibbert Laura
Current Estimated Value
Home Financials for this Owner
Home Financials are based on the most recent Mortgage that was taken out on this home.
Original Mortgage
$235,000
Outstanding Balance
$195,471
Interest Rate
4.02%
Mortgage Type
VA
Estimated Equity
$226,125
Purchase Details
Closed on
Jan 15, 2009
Sold by
Sawyers Kimberly D
Bought by
Sawyers Billy J
Home Financials for this Owner
Home Financials are based on the most recent Mortgage that was taken out on this home.
Original Mortgage
$185,592
Interest Rate
5.42%
Mortgage Type
FHA
Purchase Details
Closed on
Jun 15, 1999
Sold by
Legendary Homes Of Colorado Springs Inc
Bought by
Sawyers Billy J and Sawyers Kimberly D
Home Financials for this Owner
Home Financials are based on the most recent Mortgage that was taken out on this home.
Original Mortgage
$133,569
Interest Rate
7.02%
Mortgage Type
VA
Create a Home Valuation Report for This Property
The Home Valuation Report is an in-depth analysis detailing your home's value as well as a comparison with similar homes in the area
Home Values in the Area
Average Home Value in this Area
Purchase History
| Date | Buyer | Sale Price | Title Company |
|---|---|---|---|
| Hibbert Christopher | $235,000 | Unified Title Co | |
| Sawyers Billy J | -- | Stewart Title | |
| Sawyers Billy J | $131,000 | Unified Title Co Inc |
Source: Public Records
Mortgage History
| Date | Status | Borrower | Loan Amount |
|---|---|---|---|
| Open | Hibbert Christopher | $235,000 | |
| Previous Owner | Sawyers Billy J | $185,592 | |
| Previous Owner | Sawyers Billy J | $133,569 |
Source: Public Records
Tax History Compared to Growth
Tax History
| Year | Tax Paid | Tax Assessment Tax Assessment Total Assessment is a certain percentage of the fair market value that is determined by local assessors to be the total taxable value of land and additions on the property. | Land | Improvement |
|---|---|---|---|---|
| 2025 | $1,542 | $28,050 | -- | -- |
| 2024 | $1,382 | $29,230 | $5,180 | $24,050 |
| 2022 | $1,292 | $22,140 | $3,580 | $18,560 |
| 2021 | $1,200 | $22,780 | $3,680 | $19,100 |
| 2020 | $994 | $18,480 | $3,220 | $15,260 |
| 2019 | $975 | $18,480 | $3,220 | $15,260 |
| 2018 | $868 | $15,870 | $2,340 | $13,530 |
| 2017 | $857 | $15,870 | $2,340 | $13,530 |
| 2016 | $861 | $15,920 | $2,390 | $13,530 |
| 2015 | $862 | $15,920 | $2,390 | $13,530 |
| 2014 | $793 | $14,720 | $2,390 | $12,330 |
Source: Public Records
Map
Nearby Homes
- 895 Rancher Dr Unit FOU
- 908 Candlestar Loop N
- 850 Barn Owl Dr
- 995 Square Dance Ln
- 843 Hayloft Ln
- 7865 Wilson Rd
- 277 Turf Trail Place
- 11360 Berry Farm Rd
- 11288 Berry Farm Rd
- 11155 Falling Star Rd
- 7661 Barn Owl Dr
- 11585 Orleans Rd
- 11224 Berry Farm Rd
- 11426 Melden Way
- 10994 Tidal Run Cir
- 20785 El Nino
- 11081 Buckhead Place
- 10624 Delaney Ln
- 11130 Feliz Way
- 10617 Darneal Dr
- 1075 Clogger Ln Unit FOU
- 870 Bromefield Dr Unit FOU
- 1071 Clogger Ln Unit FOU
- 874 Bromefield Dr Unit FOU
- 863 Candlestar Loop S Unit FOU
- 859 Candlestar Loop S Unit FOU
- 867 Candlestar Loop S Unit FOU
- 1078 Clogger Ln
- 1082 Clogger Ln
- 1074 Clogger Ln
- 878 Bromefield Dr Unit FOU
- 1067 Clogger Ln Unit FOU
- 871 Candlestar Loop S Unit FOU
- 1086 Clogger Ln
- 1070 Clogger Ln
- 875 Candlestar Loop S Unit FOU
- 858 Candlestar Loop N Unit FOU
- 854 Candlestar Loop N Unit FOU
- 882 Bromefield Dr
- 1090 Clogger Ln