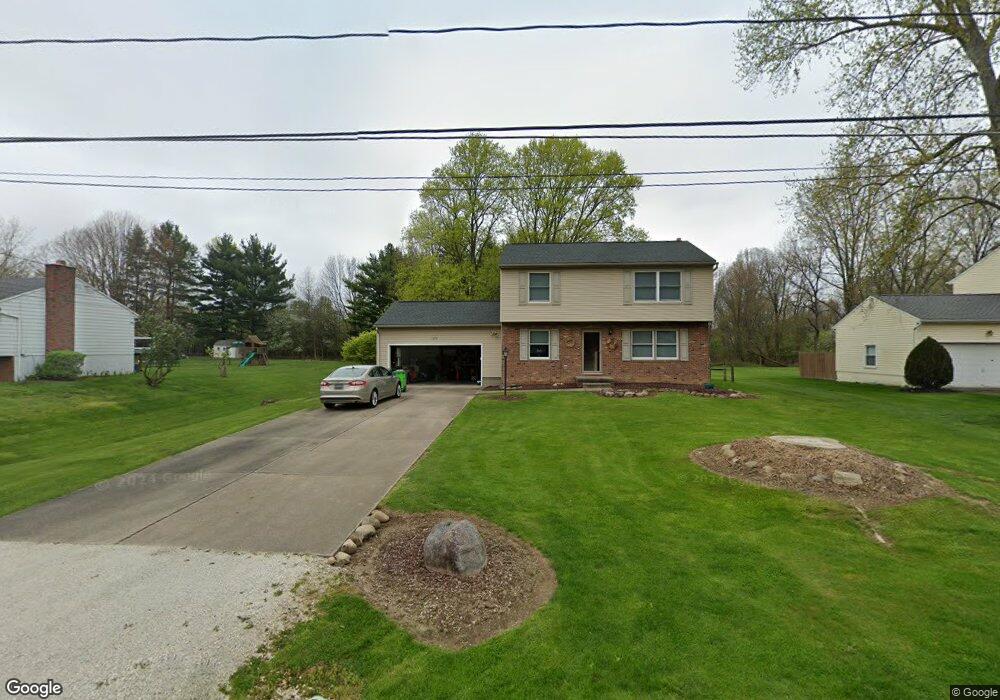
1079 Maple St Tallmadge, OH 44278
Estimated Value: $286,336 - $310,000
4
Beds
2
Baths
1,664
Sq Ft
$179/Sq Ft
Est. Value
About This Home
This home is located at 1079 Maple St, Tallmadge, OH 44278 and is currently estimated at $298,334, approximately $179 per square foot. 1079 Maple St is a home located in Summit County with nearby schools including Tallmadge Middle School, Tallmadge High School, and Cornerstone Community School.
Ownership History
Date
Name
Owned For
Owner Type
Purchase Details
Closed on
Aug 19, 2024
Sold by
Parsons Barbara A and Parsons Britney
Bought by
Barbara A Parsons Trust and Parsons
Current Estimated Value
Purchase Details
Closed on
Jan 26, 2016
Sold by
Parsons Barbara A
Bought by
Parsons Barbara A and Parsons Britney
Purchase Details
Closed on
Jun 4, 2001
Sold by
Bowers Derek A and Bowers Jennifer Braun
Bought by
Parsons Barbara A and Barbara A Parsons Trust
Purchase Details
Closed on
Jan 4, 1996
Sold by
Stager Robert L
Bought by
Bowers Derek A and Bowers Jennifer
Home Financials for this Owner
Home Financials are based on the most recent Mortgage that was taken out on this home.
Original Mortgage
$106,400
Interest Rate
7.41%
Mortgage Type
New Conventional
Create a Home Valuation Report for This Property
The Home Valuation Report is an in-depth analysis detailing your home's value as well as a comparison with similar homes in the area
Home Values in the Area
Average Home Value in this Area
Purchase History
| Date | Buyer | Sale Price | Title Company |
|---|---|---|---|
| Barbara A Parsons Trust | -- | None Listed On Document | |
| Parsons Barbara A | -- | Attorney | |
| Parsons Barbara A | $154,000 | Buckeye Reserve Title Agency | |
| Bowers Derek A | $112,000 | -- |
Source: Public Records
Mortgage History
| Date | Status | Borrower | Loan Amount |
|---|---|---|---|
| Previous Owner | Bowers Derek A | $106,400 |
Source: Public Records
Tax History Compared to Growth
Tax History
| Year | Tax Paid | Tax Assessment Tax Assessment Total Assessment is a certain percentage of the fair market value that is determined by local assessors to be the total taxable value of land and additions on the property. | Land | Improvement |
|---|---|---|---|---|
| 2025 | $3,835 | $73,998 | $15,915 | $58,083 |
| 2024 | $3,835 | $73,998 | $15,915 | $58,083 |
| 2023 | $3,835 | $73,998 | $15,915 | $58,083 |
| 2022 | $3,255 | $51,198 | $10,976 | $40,222 |
| 2021 | $3,270 | $51,198 | $10,976 | $40,222 |
| 2020 | $3,246 | $51,200 | $10,980 | $40,220 |
| 2019 | $3,584 | $50,640 | $10,980 | $39,660 |
| 2018 | $3,174 | $50,640 | $10,980 | $39,660 |
| 2017 | $2,877 | $50,640 | $10,980 | $39,660 |
| 2016 | $3,099 | $46,590 | $10,980 | $35,610 |
| 2015 | $2,877 | $46,590 | $10,980 | $35,610 |
| 2014 | $2,858 | $46,590 | $10,980 | $35,610 |
| 2013 | $2,816 | $46,730 | $10,980 | $35,750 |
Source: Public Records
Map
Nearby Homes
- 1029 Maple St
- 988 Beechwood Dr
- 1168 East Ave
- Aspire Plan at Tallmadge Reserve
- Fairview Plan at Tallmadge Reserve
- Crisfield Plan at Tallmadge Reserve
- Mitchell Plan at Tallmadge Reserve
- Passport Plan at Tallmadge Reserve
- Hampton Plan at Tallmadge Reserve
- Oakdale Plan at Tallmadge Reserve
- 206 Fawnwood Dr
- 1239 Glenoak Dr
- 330 Hanna Dr
- V/L Tallmadge Rd
- 0 East Ave
- 112 Tallmadge Rd
- 1072 Carol Ln
- 43 Benjamin Way
- 124 Tallmadge Rd
- 810 Norton Dr