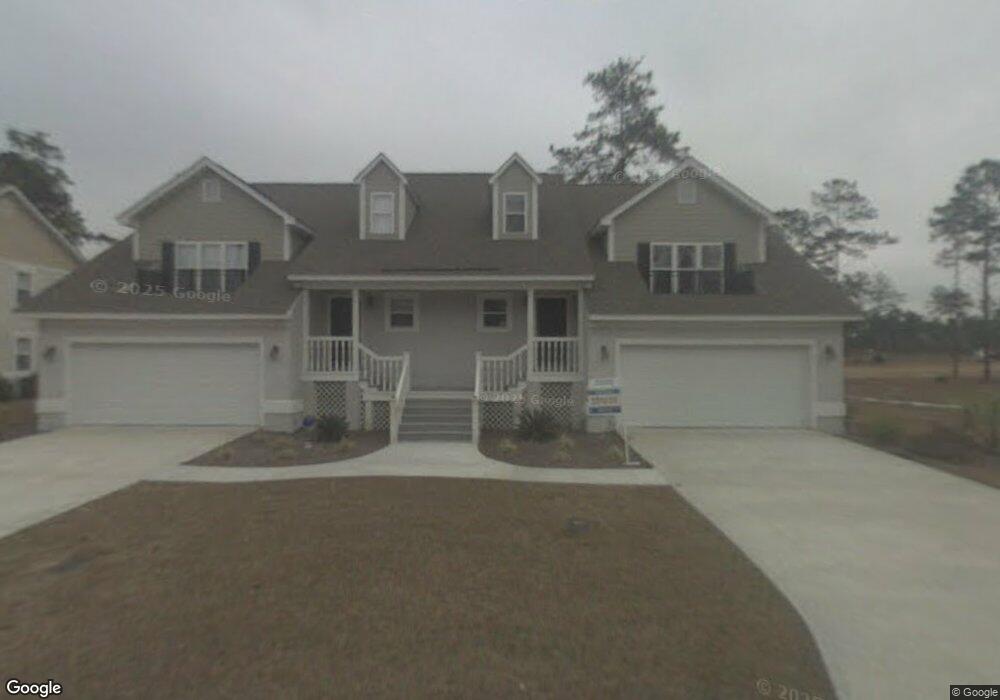
1079 Mayflower Rd NE Unit B Townsend, GA 31331
Estimated Value: $275,705 - $285,000
3
Beds
2
Baths
1,463
Sq Ft
$192/Sq Ft
Est. Value
About This Home
This home is located at 1079 Mayflower Rd NE Unit B, Townsend, GA 31331 and is currently estimated at $280,176, approximately $191 per square foot. 1079 Mayflower Rd NE Unit B is a home located in McIntosh County with nearby schools including Todd Grant Elementary School, McIntosh County Middle School, and McIntosh County Academy.
Ownership History
Date
Name
Owned For
Owner Type
Purchase Details
Closed on
Nov 15, 2024
Sold by
Adler Eric
Bought by
Coastal Haven Homes & Properties Llc
Current Estimated Value
Home Financials for this Owner
Home Financials are based on the most recent Mortgage that was taken out on this home.
Original Mortgage
$165,000
Interest Rate
6.44%
Mortgage Type
New Conventional
Purchase Details
Closed on
Sep 16, 2021
Sold by
Mitchell Christopher
Bought by
Adler Eric and Adler Holly
Purchase Details
Closed on
Jan 20, 2021
Sold by
Smith James B
Bought by
Mitchell Christopher D
Home Financials for this Owner
Home Financials are based on the most recent Mortgage that was taken out on this home.
Original Mortgage
$160,200
Interest Rate
2.6%
Mortgage Type
FHA
Purchase Details
Closed on
Feb 23, 2010
Sold by
Deloach Richard C
Bought by
Smith James B and Smith Katie A
Purchase Details
Closed on
Jan 5, 2009
Sold by
Jts Investments Inc
Bought by
Deloach Richard C
Purchase Details
Closed on
Nov 30, 2007
Sold by
J T Investments
Bought by
East Coast Developers Inc
Purchase Details
Closed on
Aug 23, 2007
Sold by
East Coast Developers Inc
Bought by
Colony Dental Care Pc
Create a Home Valuation Report for This Property
The Home Valuation Report is an in-depth analysis detailing your home's value as well as a comparison with similar homes in the area
Purchase History
| Date | Buyer | Sale Price | Title Company |
|---|---|---|---|
| Coastal Haven Homes & Properties Llc | $220,000 | -- | |
| Adler Eric | $210,000 | -- | |
| Mitchell Christopher D | $178,000 | -- | |
| Smith James B | $225,000 | -- | |
| Deloach Richard C | $200,000 | -- | |
| East Coast Developers Inc | $149,000 | -- | |
| Colony Dental Care Pc | $235,000 | -- |
Source: Public Records
Mortgage History
| Date | Status | Borrower | Loan Amount |
|---|---|---|---|
| Closed | Coastal Haven Homes & Properties Llc | $165,000 | |
| Previous Owner | Mitchell Christopher D | $160,200 |
Source: Public Records
Tax History
| Year | Tax Paid | Tax Assessment Tax Assessment Total Assessment is a certain percentage of the fair market value that is determined by local assessors to be the total taxable value of land and additions on the property. | Land | Improvement |
|---|---|---|---|---|
| 2024 | $2,972 | $101,640 | $7,400 | $94,240 |
| 2023 | $2,894 | $98,480 | $7,400 | $91,080 |
| 2022 | $2,421 | $81,480 | $6,000 | $75,480 |
| 2021 | $1,672 | $62,920 | $6,000 | $56,920 |
| 2020 | $1,867 | $66,520 | $6,000 | $60,520 |
| 2019 | $1,720 | $64,720 | $6,000 | $58,720 |
| 2018 | $1,720 | $64,720 | $6,000 | $58,720 |
| 2017 | $1,691 | $59,880 | $6,000 | $53,880 |
| 2016 | $1,601 | $56,520 | $6,000 | $50,520 |
| 2015 | $1,730 | $62,168 | $7,500 | $54,668 |
| 2014 | $1,733 | $62,168 | $7,500 | $54,668 |
Source: Public Records
Map
Nearby Homes
- 1151 Mayflower Rd NE
- 1079 Mayflower Rd NE
- 1033 Mayflower Rd NE
- 749 Mayflower Rd NE
- 1029 Fountain St NE
- Lot 266 NE Coopers Point Dr NE
- 1186 Coopers Point Dr NE
- 1045 Par Dr NE
- 7272 Shellman Bluff Rd NE Unit 22
- 7272 Shellman Bluff Rd NE Unit 14
- 7272 Shellman Bluff Rd NE Unit 17
- 7272 Shellman Bluff Rd NE
- 642 NE Dune Meadow Dr
- xx Sapelo Park Dr NE
- 1068 Picnic Ln NE
- LOT 239 Coopers Landing Dr NE
- Lot 618 Coopers Landing Dr NE
- Lot 617 Coopers Landing Dr NE
- 1017 NE Village Green Dr
- 1033 Wood Stork Dr NE
- 1079 Mayflower Rd NE Unit 4B
- 1079 Mayflower Rd NE Unit B
- 1079 Mayflower Rd NE
- 1079 Mayflower Rd NE Unit 4B
- 1071 Mayflower Rd NE Unit 4A
- 1071 Mayflower Rd
- 1063 Mayflower Rd NE Unit B
- 1051 Mayflower Rd NE
- 1051 Mayflower Rd NE Unit A
- 1095 Mayflower Rd Unit 5B
- 1033 Mayflower Rd NE
- 1033 Mayflower Rd NE Unit A
- 1033 Mayflower Rd NE Unit 2A
- 1033 Mayflower Rd NE Unit 2A
- 1033 Mayflower Rd NE Unit A
- 1111 Mayflower Rd NE Unit B
- 1111 Mayflower Rd NE
- 1111 Mayflower Rd NE Unit 6A
- 1041 Mayflower Rd NE Unit B
- 1041 Mayflower Rd NE Unit 2B
Your Personal Tour Guide
Ask me questions while you tour the home.