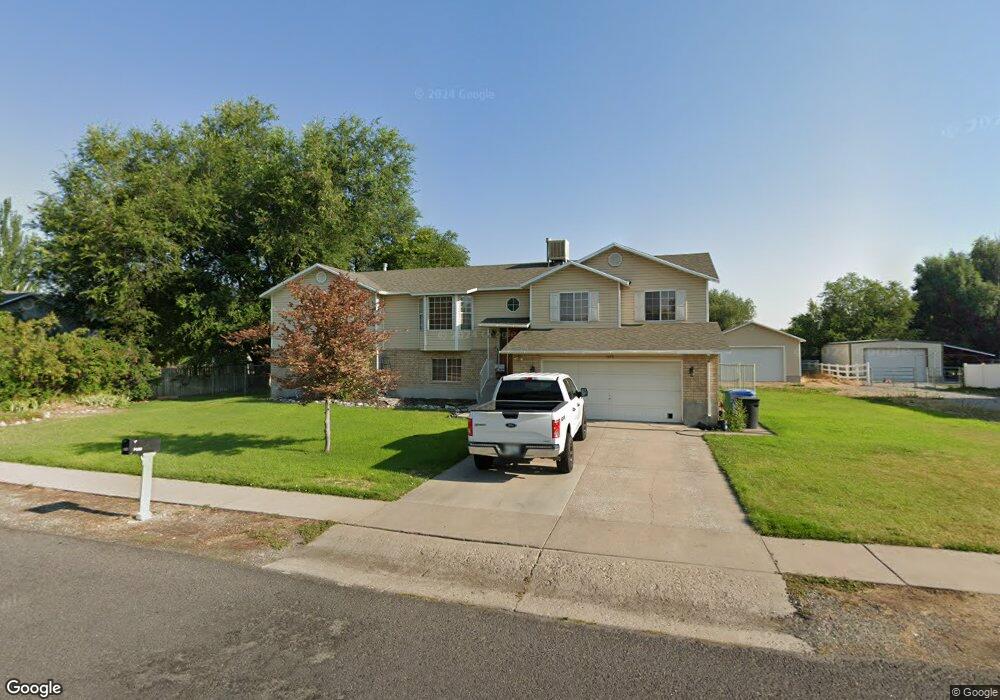
1079 W 350 S Logan, UT 84321
Woodruff NeighborhoodEstimated Value: $525,000 - $587,000
5
Beds
3
Baths
2,870
Sq Ft
$191/Sq Ft
Est. Value
About This Home
This home is located at 1079 W 350 S, Logan, UT 84321 and is currently estimated at $549,410, approximately $191 per square foot. 1079 W 350 S is a home located in Cache County with nearby schools including Woodruff School, Mount Logan Middle School, and Logan High School.
Ownership History
Date
Name
Owned For
Owner Type
Purchase Details
Closed on
Sep 4, 2020
Sold by
Harris Steve L and Harris Stephanie Ann
Bought by
Cerda Kayci
Current Estimated Value
Home Financials for this Owner
Home Financials are based on the most recent Mortgage that was taken out on this home.
Original Mortgage
$310,500
Outstanding Balance
$274,815
Interest Rate
3%
Mortgage Type
New Conventional
Estimated Equity
$274,595
Purchase Details
Closed on
Mar 16, 2009
Sold by
Harris Steven L and Harris Stephanie Ann
Bought by
Harris Steve L and Harris Stephanie Ann
Home Financials for this Owner
Home Financials are based on the most recent Mortgage that was taken out on this home.
Original Mortgage
$160,000
Interest Rate
5.19%
Mortgage Type
New Conventional
Create a Home Valuation Report for This Property
The Home Valuation Report is an in-depth analysis detailing your home's value as well as a comparison with similar homes in the area
Home Values in the Area
Average Home Value in this Area
Purchase History
| Date | Buyer | Sale Price | Title Company |
|---|---|---|---|
| Cerda Kayci | -- | Northern Title Company | |
| Harris Steve L | -- | Advanced Title |
Source: Public Records
Mortgage History
| Date | Status | Borrower | Loan Amount |
|---|---|---|---|
| Open | Cerda Kayci | $310,500 | |
| Previous Owner | Harris Steve L | $160,000 |
Source: Public Records
Tax History
| Year | Tax Paid | Tax Assessment Tax Assessment Total Assessment is a certain percentage of the fair market value that is determined by local assessors to be the total taxable value of land and additions on the property. | Land | Improvement |
|---|---|---|---|---|
| 2025 | $2,298 | $297,265 | $0 | $0 |
| 2024 | $2,385 | $298,755 | $0 | $0 |
| 2023 | $2,476 | $295,610 | $0 | $0 |
| 2022 | $2,273 | $253,480 | $0 | $0 |
| 2021 | $2,227 | $383,700 | $75,000 | $308,700 |
| 2020 | $2,070 | $320,916 | $75,000 | $245,916 |
| 2019 | $2,164 | $320,916 | $75,000 | $245,916 |
| 2018 | $2,133 | $288,840 | $75,000 | $213,840 |
| 2017 | $2,012 | $144,045 | $0 | $0 |
| 2016 | $2,086 | $144,045 | $0 | $0 |
| 2015 | $1,722 | $118,800 | $0 | $0 |
| 2014 | $1,409 | $107,560 | $0 | $0 |
| 2013 | -- | $107,560 | $0 | $0 |
Source: Public Records
Map
Nearby Homes
- 1031 W 350 S
- 370 S 1200 W Unit 2
- 1099 Three Pointe Ave
- 952 W 330 S
- 248 Sunstone Ct
- 1400 S 940 W
- 1033 W 500 S
- 508 S 1215 W Unit 144
- 1227 W 500 S Unit 151
- 521 S 1215 W Unit 126
- 539 S 1215 W Unit 129
- 545 S 1215 W
- 551 S 1215 W Unit 131
- 551 S 1215 W
- 1214 W 575 S
- 1239 W 575 S
- Hemlock Plan at Sugar Creek - Logan
- Eucalyptus Plan at Sugar Creek - Logan
- Blackberry Plan at Sugar Creek - Logan
- Magnolia Plan at Sugar Creek - Logan
Your Personal Tour Guide
Ask me questions while you tour the home.