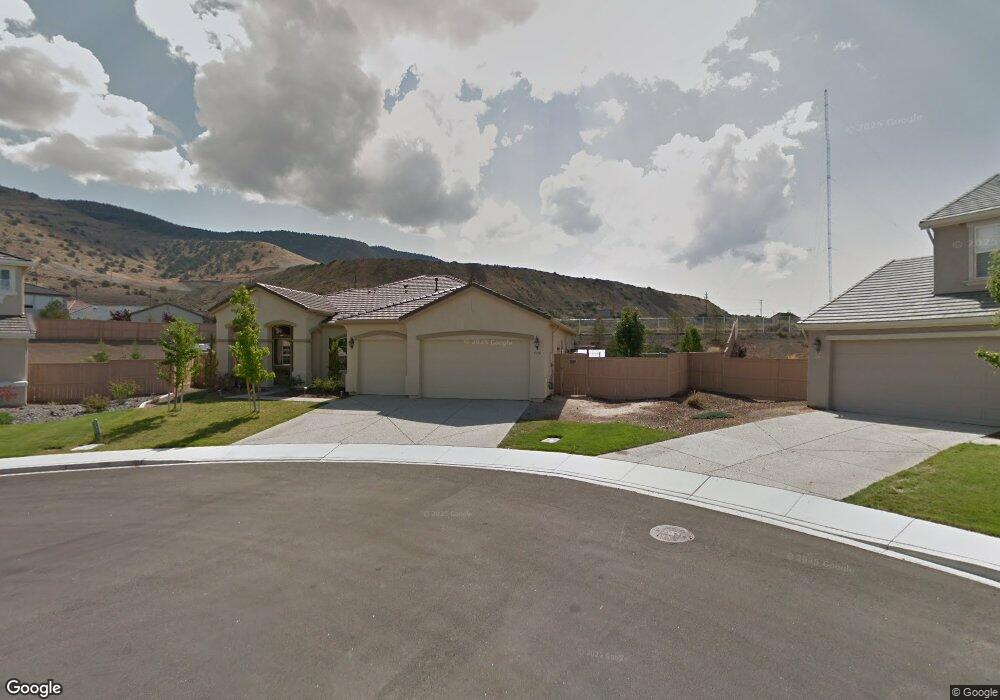
10790 Cypress Garden Ct Reno, NV 89521
Virginia Foothills NeighborhoodEstimated Value: $790,000 - $840,575
4
Beds
3
Baths
2,371
Sq Ft
$344/Sq Ft
Est. Value
About This Home
This home is located at 10790 Cypress Garden Ct, Reno, NV 89521 and is currently estimated at $814,644, approximately $343 per square foot. 10790 Cypress Garden Ct is a home located in Washoe County with nearby schools including Jwood Raw Elementary School, Kendyl Depoali Middle School, and Damonte Ranch High School.
Ownership History
Date
Name
Owned For
Owner Type
Purchase Details
Closed on
Oct 23, 2015
Sold by
Stiner Joell R and Key James R
Bought by
Stiner Joell R and Key James R
Current Estimated Value
Home Financials for this Owner
Home Financials are based on the most recent Mortgage that was taken out on this home.
Original Mortgage
$348,000
Outstanding Balance
$273,710
Interest Rate
3.87%
Mortgage Type
New Conventional
Estimated Equity
$540,934
Purchase Details
Closed on
Apr 15, 2009
Sold by
Stiner Joell R and Key James R
Bought by
Stiner Joell R and Key James R
Home Financials for this Owner
Home Financials are based on the most recent Mortgage that was taken out on this home.
Original Mortgage
$301,492
Interest Rate
5.02%
Mortgage Type
FHA
Purchase Details
Closed on
May 31, 2006
Sold by
Lennar Reno Llc
Bought by
Stiner Joell R
Home Financials for this Owner
Home Financials are based on the most recent Mortgage that was taken out on this home.
Original Mortgage
$360,000
Interest Rate
7.95%
Mortgage Type
Unknown
Create a Home Valuation Report for This Property
The Home Valuation Report is an in-depth analysis detailing your home's value as well as a comparison with similar homes in the area
Home Values in the Area
Average Home Value in this Area
Purchase History
| Date | Buyer | Sale Price | Title Company |
|---|---|---|---|
| Stiner Joell R | -- | Capital Title Co Of Nevada | |
| Stiner Joell R | -- | Trust Title | |
| Stiner Joell R | $450,000 | North American Title Co |
Source: Public Records
Mortgage History
| Date | Status | Borrower | Loan Amount |
|---|---|---|---|
| Open | Stiner Joell R | $348,000 | |
| Closed | Stiner Joell R | $301,492 | |
| Closed | Stiner Joell R | $360,000 |
Source: Public Records
Tax History Compared to Growth
Tax History
| Year | Tax Paid | Tax Assessment Tax Assessment Total Assessment is a certain percentage of the fair market value that is determined by local assessors to be the total taxable value of land and additions on the property. | Land | Improvement |
|---|---|---|---|---|
| 2025 | $4,446 | $178,836 | $54,530 | $124,306 |
| 2024 | $4,446 | $169,706 | $44,555 | $125,151 |
| 2023 | $4,317 | $164,646 | $49,140 | $115,506 |
| 2022 | $4,099 | $137,493 | $41,440 | $96,053 |
| 2021 | $3,981 | $135,501 | $40,145 | $95,356 |
| 2020 | $3,862 | $132,839 | $37,415 | $95,424 |
| 2019 | $3,748 | $128,913 | $36,925 | $91,988 |
| 2018 | $3,635 | $115,419 | $26,040 | $89,379 |
| 2017 | $3,533 | $115,408 | $26,040 | $89,368 |
| 2016 | $3,443 | $115,756 | $24,430 | $91,326 |
| 2015 | $3,437 | $112,799 | $21,945 | $90,854 |
| 2014 | $3,342 | $98,642 | $17,500 | $81,142 |
| 2013 | -- | $88,037 | $15,190 | $72,847 |
Source: Public Records
Map
Nearby Homes
- 10698 Autumn Walk Ln
- 2432 Kate's Bridge Dr Unit Glenwood 546
- 10700 Summer Glen Dr
- 15026 Iron River Dr
- 10841 Crooked Canyon Dr
- 15025 Iron River Dr
- 2348 Hammer Falls Dr
- 10650 Cedar Bend Ct
- 2590 Spring Flower Dr
- 14058 Wingspread Ln
- 10735 Copper Lake Dr Unit 15A
- 10825 Farmstead Ln
- 10630 Birch Point Ct
- 12518 Brass Ridge St
- 10595 Baton Ct
- 3028 Amethyst Hills Dr
- Quincy Plan at Regency at Caramella Ranch - Claymont Collection
- Yardley Plan at Regency at Caramella Ranch - Glenwood Collection
- Ascott Plan at Regency at Caramella Ranch - Glenwood Collection
- Bayberry Plan at Regency at Caramella Ranch - Mayfield Collection
- 10770 Cypress Garden Ct Unit 17B
- 10795 Cypress Garden Ct
- 10865 Sand Hollow Ct
- 2833 Thistle Pine Ct
- 2833 Thistle Pine Ct Unit Homesite 16
- 2837 Thistle Pine Ct Unit Homesite 17
- 2829 Thistle Pine Ct
- 2829 Thistle Pine Ct Unit Homesite 15
- 10750 Cypress Garden Ct
- 2825 Thistle Pine Ct
- 2825 Thistle Pine Ct Unit Homesite 14
- 10775 Cypress Garden Ct
- 2821 Thistle Pine Ct Unit Homesite 13
- 10885 Sand Hollow Ct
- 10755 Cypress Garden Ct
- 10845 Sand Hollow Ct
- 2817 Thistle Pine Ct Unit Homesite 12
- 2780 Beach River Dr
- 2813 Thistle Pine Ct
- 2770 Beach River Dr