Estimated Value: $317,000 - $359,999
4
Beds
2
Baths
2,678
Sq Ft
$128/Sq Ft
Est. Value
About This Home
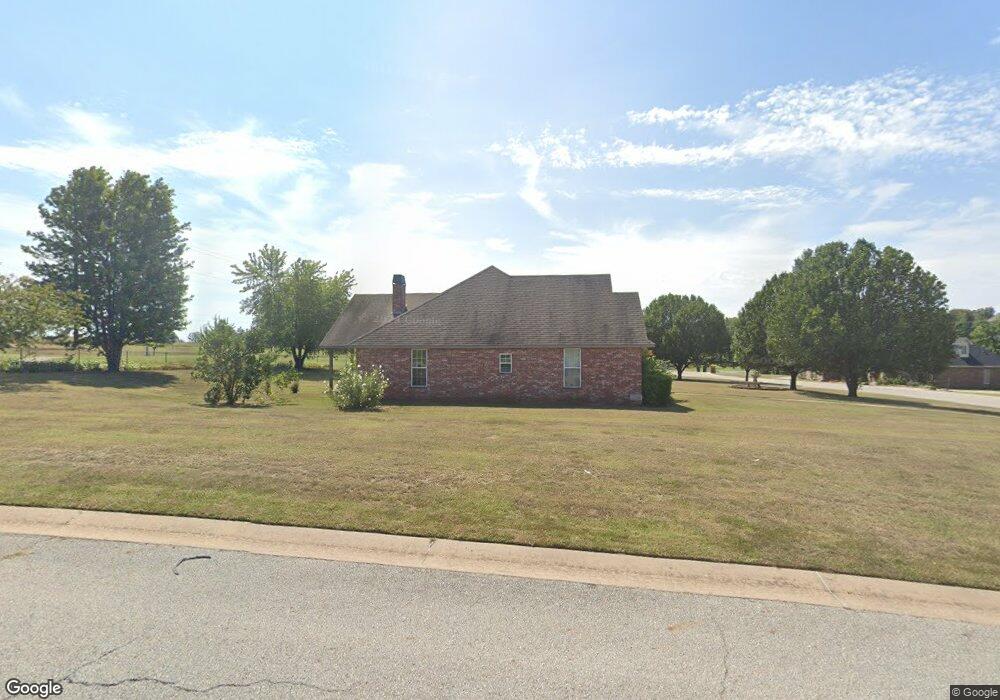
This home is located at 10791 Wea Cir, Miami, OK 74354 and is currently estimated at $343,250, approximately $128 per square foot. 10791 Wea Cir is a home located in Ottawa County with nearby schools including Miami High School.
Ownership History
Date
Name
Owned For
Owner Type
Purchase Details
Closed on
Jan 30, 2008
Sold by
Rush Billy G and Rush Tina K
Bought by
Zin Thant and Lin Su Su
Current Estimated Value
Home Financials for this Owner
Home Financials are based on the most recent Mortgage that was taken out on this home.
Original Mortgage
$178,000
Outstanding Balance
$111,156
Interest Rate
5.87%
Mortgage Type
Adjustable Rate Mortgage/ARM
Estimated Equity
$232,094
Purchase Details
Closed on
Jan 25, 2006
Sold by
Larco Properties Llc
Bought by
Rush Billy G and Rush Tina K
Home Financials for this Owner
Home Financials are based on the most recent Mortgage that was taken out on this home.
Original Mortgage
$179,000
Interest Rate
6.22%
Mortgage Type
Assumption
Purchase Details
Closed on
Apr 7, 2005
Sold by
Housing Authority Of The Peoria Tribe Of
Bought by
Larco Properties Llc
Purchase Details
Closed on
Nov 29, 2004
Bought by
Larco Properties Llc
Create a Home Valuation Report for This Property
The Home Valuation Report is an in-depth analysis detailing your home's value as well as a comparison with similar homes in the area
Home Values in the Area
Average Home Value in this Area
Purchase History
| Date | Buyer | Sale Price | Title Company |
|---|---|---|---|
| Zin Thant | $222,500 | None Available | |
| Rush Billy G | $199,333 | None Available | |
| Larco Properties Llc | -- | None Available | |
| Larco Properties Llc | -- | -- |
Source: Public Records
Mortgage History
| Date | Status | Borrower | Loan Amount |
|---|---|---|---|
| Open | Zin Thant | $178,000 | |
| Previous Owner | Rush Billy G | $179,000 |
Source: Public Records
Tax History Compared to Growth
Tax History
| Year | Tax Paid | Tax Assessment Tax Assessment Total Assessment is a certain percentage of the fair market value that is determined by local assessors to be the total taxable value of land and additions on the property. | Land | Improvement |
|---|---|---|---|---|
| 2024 | $3,052 | $31,657 | $1,368 | $30,289 |
| 2023 | $3,052 | $30,150 | $1,368 | $28,782 |
| 2022 | $2,654 | $28,714 | $1,368 | $27,346 |
| 2021 | $2,584 | $27,347 | $1,368 | $25,979 |
| 2020 | $2,482 | $26,044 | $2,394 | $23,650 |
| 2019 | $2,138 | $26,044 | $2,394 | $23,650 |
| 2018 | $2,153 | $26,044 | $2,394 | $23,650 |
| 2017 | $2,188 | $26,044 | $2,394 | $23,650 |
| 2016 | $2,140 | $26,633 | $2,394 | $24,239 |
| 2015 | $2,003 | $23,862 | $2,280 | $21,582 |
| 2014 | $2,078 | $25,365 | $5,073 | $20,292 |
Source: Public Records
Map
Nearby Homes
- 59608 W Peoria Cir
- 0 E 110 Rd Unit 25-2147
- 0 S 600 Rd Unit 24321477
- 59501 E 100 Rd
- 10526 S 590 Rd
- 9985 S 593 Rd
- 11801 S 600 Rd
- 58920 E 102 Rd
- 11631 S 587 Rd
- 11703 S 587 Rd
- 9021 S 614 Rd Unit Lot 4
- 60250 E 90 Rd
- 10301 S 600 Rd
- 60901 E 130 Rd
- 0 S Arrow Rd Unit 24-1901
- 62551 E 115 Rd
- 60400 E 140 Rd
- 1216 Johnson Dr
- 1831 7th Ave NE
- 2003 E Rockdale Rd
- 10891 Wea Cir
- 0 Wea Cir
- 10751 Wea Cir
- 10871 Wea Cir
- 59920 E Kaskaskia
- 59923 E Kaskaskia
- 0 E Kaskaskia
- 59890 E Kaskaskia
- 59891 E Kaskaskia
- 10177 Cahocia Cir
- 10810 E Peoria Cir
- 10720 Cahocia Cir
- 10720 S Cahokia Cir
- 10820 E Peoria Cir
- 10790 Cahocia Cir
- 10850 E Peoria Cir
- 10880 W Peoria Cir
- 10880 E Peoria Cir
- 10177 S Cahokia Cir
- 10891 W Peoria Cir