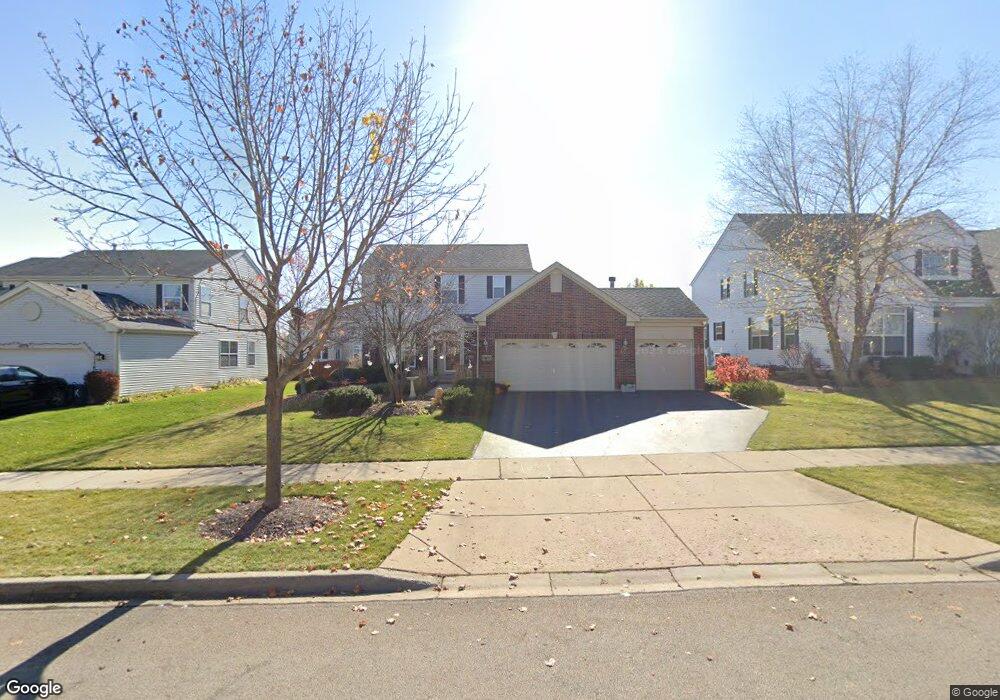
10793 Oregon Trail Huntley, IL 60142
Estimated Value: $449,472 - $457,000
3
Beds
3
Baths
1,900
Sq Ft
$238/Sq Ft
Est. Value
About This Home
This home is located at 10793 Oregon Trail, Huntley, IL 60142 and is currently estimated at $452,368, approximately $238 per square foot. 10793 Oregon Trail is a home located in McHenry County with nearby schools including Martin Elementary School, Chesak Elementary School, and Heineman Middle School.
Ownership History
Date
Name
Owned For
Owner Type
Purchase Details
Closed on
Feb 6, 2024
Sold by
Morano William R and Jensen Jennifer A
Bought by
William Richard Morano Revocable Trust and Jennifer Ann Morano Revocable Trust
Current Estimated Value
Purchase Details
Closed on
Aug 9, 2008
Sold by
Hromyak David M and Hromyak Maribeth
Bought by
Morano William R and Jensen Jennifer A
Home Financials for this Owner
Home Financials are based on the most recent Mortgage that was taken out on this home.
Original Mortgage
$260,263
Interest Rate
6.42%
Mortgage Type
FHA
Purchase Details
Closed on
Jun 24, 2005
Sold by
Wing Pointe North Llc
Bought by
Hromyak David M and Hromyak Maribeth
Home Financials for this Owner
Home Financials are based on the most recent Mortgage that was taken out on this home.
Original Mortgage
$257,500
Interest Rate
5.25%
Mortgage Type
Purchase Money Mortgage
Create a Home Valuation Report for This Property
The Home Valuation Report is an in-depth analysis detailing your home's value as well as a comparison with similar homes in the area
Home Values in the Area
Average Home Value in this Area
Purchase History
| Date | Buyer | Sale Price | Title Company |
|---|---|---|---|
| William Richard Morano Revocable Trust | -- | None Listed On Document | |
| Morano William R | $265,000 | Ticor Title | |
| Hromyak David M | $357,390 | First American Title Ins Co |
Source: Public Records
Mortgage History
| Date | Status | Borrower | Loan Amount |
|---|---|---|---|
| Previous Owner | Morano William R | $260,263 | |
| Previous Owner | Hromyak David M | $257,500 |
Source: Public Records
Tax History Compared to Growth
Tax History
| Year | Tax Paid | Tax Assessment Tax Assessment Total Assessment is a certain percentage of the fair market value that is determined by local assessors to be the total taxable value of land and additions on the property. | Land | Improvement |
|---|---|---|---|---|
| 2024 | $8,237 | $123,994 | $11,644 | $112,350 |
| 2023 | $8,003 | $111,385 | $10,460 | $100,925 |
| 2022 | $7,636 | $101,425 | $9,525 | $91,900 |
| 2021 | $7,404 | $95,522 | $8,971 | $86,551 |
| 2020 | $7,279 | $92,975 | $8,732 | $84,243 |
| 2019 | $7,108 | $90,601 | $8,509 | $82,092 |
| 2018 | $4,654 | $60,686 | $9,575 | $51,111 |
| 2017 | $4,549 | $57,192 | $9,024 | $48,168 |
| 2016 | $4,581 | $54,376 | $8,580 | $45,796 |
| 2013 | -- | $63,687 | $14,021 | $49,666 |
Source: Public Records
Map
Nearby Homes
- 10880 Potomac Dr
- 10592 Capitol Ln
- 10631 Oregon Trail
- 10804 Concord Ln
- 0 Ruth Rd Unit MRD12258953
- 2.54 Ruth Rd
- 10392 Hunter Trail
- 10434 Casselberry S
- 10826 Timer Dr W Unit 2
- 10846 Timer Dr W Unit 2
- 11314 Algonquin Rd Unit C
- 10419 Evendale Rd
- 10783 Chadsey Rd
- 10794 Saxony St
- 10784 Saxony St
- 10702 Chadsey Rd
- 10774 Saxony St
- 10764 Saxony St
- 10754 Saxony St
- 10795 Saxony St
- 10779 Oregon Trail
- 10805 Oregon Trail
- 10767 Oregon Trail
- 10794 Santa fe Trail
- 10819 Oregon Trail
- 10780 Santa fe Trail
- 10806 Santa fe Trail
- 10794 Oregon Trail
- 10806 Oregon Trail
- 10780 Oregon Trail
- 10768 Santa fe Trail
- 10753 Oregon Trail
- 10768 Oregon Trail
- 10820 Oregon Trail
- 10754 Santa fe Trail
- 10754 Oregon Trail
- 10739 Oregon Trail
- 10631 Nantucket Ln
- 10742 Santa fe Trail
- 10643 Nantucket Ln