
Seller's Agent in 2025
Brett Friedmann
BHHS Georgia Properties
(404) 226-8988
16 Total Sales
Estimated Value: $499,000 - $557,199
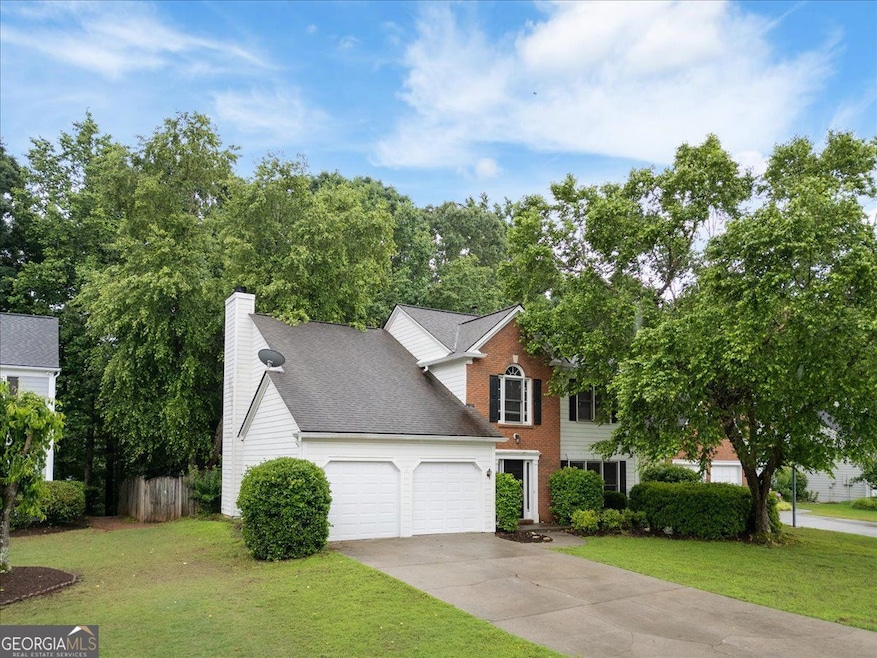
Tucked away on a quiet cul-de-sac, this inviting home offers incredible potential in a sought-after communities. With its welcoming floor plan and seamless flow, the main level features an open-concept layout where the kitchen effortlessly connects to the breakfast nook and family room-an ideal space ready to become the heart of the home. Step outside to a level, fenced backyard-perfect for weekend gatherings, outdoor play, or relaxing evenings under the stars. Upstairs, you'll find four generously sized bedrooms and two full bathrooms, offering flexibility for growing households or home office needs. With charming curb appeal and solid bones, this property is ready for a fresh vision. Located in a desirable swim/tennis community just minutes from top-rated schools, shopping, dining, and everyday conveniences. Enjoy easy access to Cauley Creek Park and the future Medley Johns Creek entertainment district-making this location as vibrant as it is convenient. A long-time rental, the home is being sold as-is and priced with renovation in mind. A rare opportunity to personalize a home in a prime neighborhood and make it your own.
Last Agent to Sell the Property
BHHS Georgia Properties License #251383 Listed on: 05/30/2025
| Date | Buyer | Sale Price | Title Company |
|---|---|---|---|
| Dong Yulu | $499,900 | -- | |
| Bronfman Darrin S | -- | -- | |
| Bronfman Darrin S | -- | -- | |
| Bronfman Darrin S | $193,000 | -- | |
| Beam Gary L | $147,500 | -- |
| Date | Status | Borrower | Loan Amount |
|---|---|---|---|
| Previous Owner | Bronfman Darrin S | $78,000 | |
| Previous Owner | Bronfman Darrin S | $120,000 | |
| Closed | Beam Gary L | $0 |
| Date | Event | Price | List to Sale | Price per Sq Ft |
|---|---|---|---|---|
| 06/20/2025 06/20/25 | Sold | $499,900 | 0.0% | $238 / Sq Ft |
| 06/02/2025 06/02/25 | Pending | -- | -- | -- |
| 05/30/2025 05/30/25 | For Sale | $499,900 | -- | $238 / Sq Ft |
| Year | Tax Paid | Tax Assessment Tax Assessment Total Assessment is a certain percentage of the fair market value that is determined by local assessors to be the total taxable value of land and additions on the property. | Land | Improvement |
|---|---|---|---|---|
| 2025 | $6,366 | $209,360 | $60,680 | $148,680 |
| 2023 | $6,366 | $184,160 | $46,480 | $137,680 |
| 2022 | $4,735 | $154,320 | $32,560 | $121,760 |
| 2021 | $3,897 | $123,680 | $33,240 | $90,440 |
| 2020 | $3,935 | $122,240 | $32,880 | $89,360 |
| 2019 | $473 | $120,080 | $32,280 | $87,800 |
| 2018 | $3,818 | $117,240 | $31,520 | $85,720 |
| 2017 | $3,265 | $95,920 | $28,840 | $67,080 |
| 2016 | $3,217 | $95,920 | $28,840 | $67,080 |
| 2015 | $3,253 | $95,920 | $28,840 | $67,080 |
| 2014 | $2,878 | $81,600 | $24,560 | $57,040 |
Seller's Agent in 2025
Brett Friedmann
BHHS Georgia Properties
(404) 226-8988
16 Total Sales
Buyer's Agent in 2025
Glenda Broker
Non-Mls Company
(800) 289-1214
Source: Georgia MLS
MLS Number: 10532971
APN: 11-1011-0370-112-7
Disclaimer: Certain information contained herein is derived from information provided by parties other than Homes.com. All information provided is deemed reliable, but is not guaranteed to be accurate and should be independently verified.
![]() The data relating to real estate for sale on this web site comes in part from the Broker Reciprocity Program of Georgia MLS. Real estate listings held by brokerage firms other than Redfin are marked with the Broker Reciprocity logo and detailed information about them includes the name of the listing brokers. Information deemed reliable but not guaranteed. Copyright 2026 Georgia MLS. All rights reserved.
The data relating to real estate for sale on this web site comes in part from the Broker Reciprocity Program of Georgia MLS. Real estate listings held by brokerage firms other than Redfin are marked with the Broker Reciprocity logo and detailed information about them includes the name of the listing brokers. Information deemed reliable but not guaranteed. Copyright 2026 Georgia MLS. All rights reserved.
Ask me questions while you tour the home.