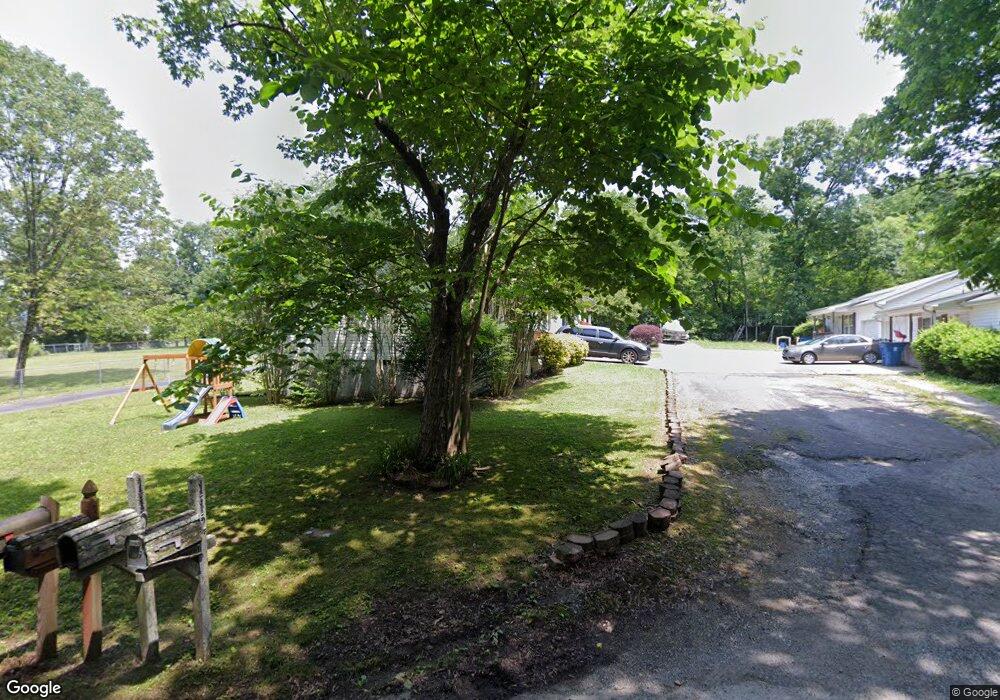
108 Aleda St Unit 1 Rossville, GA 30741
Estimated Value: $181,000 - $270,000
3
Beds
2
Baths
1,512
Sq Ft
$159/Sq Ft
Est. Value
About This Home
This home is located at 108 Aleda St Unit 1, Rossville, GA 30741 and is currently estimated at $240,079, approximately $158 per square foot. 108 Aleda St Unit 1 is a home located in Walker County with nearby schools including Stone Creek Elementary School, Rossville Middle School, and Ridgeland High School.
Ownership History
Date
Name
Owned For
Owner Type
Purchase Details
Closed on
Nov 19, 2020
Sold by
Keith Brandon
Bought by
Shreef Zachary D
Current Estimated Value
Home Financials for this Owner
Home Financials are based on the most recent Mortgage that was taken out on this home.
Original Mortgage
$147,283
Outstanding Balance
$130,304
Interest Rate
2.8%
Mortgage Type
FHA
Estimated Equity
$109,775
Purchase Details
Closed on
Jan 31, 2017
Sold by
Burch Charles M
Bought by
Keith Brandon
Home Financials for this Owner
Home Financials are based on the most recent Mortgage that was taken out on this home.
Original Mortgage
$103,098
Interest Rate
5.5%
Mortgage Type
FHA
Purchase Details
Closed on
Mar 4, 2014
Sold by
Atkins Rena
Bought by
Burch Charles M and Burch Diana S
Purchase Details
Closed on
Aug 16, 2002
Sold by
Palmer James P and Palmer Kimberly B
Bought by
Atkins Ray and Rena Atkins
Purchase Details
Closed on
Jun 11, 2001
Bought by
Palmer James P and Palmer Kimberly B
Create a Home Valuation Report for This Property
The Home Valuation Report is an in-depth analysis detailing your home's value as well as a comparison with similar homes in the area
Home Values in the Area
Average Home Value in this Area
Purchase History
| Date | Buyer | Sale Price | Title Company |
|---|---|---|---|
| Shreef Zachary D | $150,000 | -- | |
| Keith Brandon | $105,000 | -- | |
| Burch Charles M | $50,000 | -- | |
| Atkins Ray | $92,300 | -- | |
| Palmer James P | $13,500 | -- |
Source: Public Records
Mortgage History
| Date | Status | Borrower | Loan Amount |
|---|---|---|---|
| Open | Shreef Zachary D | $147,283 | |
| Previous Owner | Keith Brandon | $103,098 |
Source: Public Records
Tax History Compared to Growth
Tax History
| Year | Tax Paid | Tax Assessment Tax Assessment Total Assessment is a certain percentage of the fair market value that is determined by local assessors to be the total taxable value of land and additions on the property. | Land | Improvement |
|---|---|---|---|---|
| 2024 | $2,565 | $78,560 | $4,800 | $73,760 |
| 2023 | $2,470 | $74,816 | $4,800 | $70,016 |
| 2022 | $1,641 | $62,336 | $4,800 | $57,536 |
| 2021 | $1,505 | $51,264 | $4,800 | $46,464 |
| 2020 | $1,298 | $42,314 | $4,800 | $37,514 |
| 2019 | $1,299 | $42,314 | $4,800 | $37,514 |
| 2018 | $1,259 | $42,314 | $4,800 | $37,514 |
| 2017 | $1,407 | $42,314 | $4,800 | $37,514 |
| 2016 | $1,221 | $44,298 | $4,800 | $39,498 |
| 2015 | $1,664 | $57,504 | $4,000 | $53,504 |
| 2014 | -- | $57,504 | $4,000 | $53,504 |
| 2013 | -- | $57,504 | $4,000 | $53,504 |
Source: Public Records
Map
Nearby Homes
- 4 Carroll Ln
- 1204 Wooden Ave
- 105 Elm St
- 1204 Logan Ave
- 126 S Liner St
- 136 Summit St
- Lot 81 Battle Bluff Dr
- 1100 Logan Ave
- 1014 Lee Ave
- 98 Stegall St
- 164 S Mission Ridge Dr
- 916 Logan Ave
- 816 Indian Ave
- 200 W Oak St
- 806 Mcfarland Ave
- 1 Fox Chase St
- 703 Julian St
- 3 Fox Chase St
- 702 Short St
- 189 Leinbach Rd
- 108 Aleda St
- 1404 Mcfarland Ave
- 110 Aleda St
- 100 Aleda St
- 1402 Mcfarland Ave
- 1408 Mcfarland Ave
- 106 Aleda St Unit 1
- 106 Aleda St
- 2 Carroll Ln
- 2 Carroll Ln
- 25 Carroll Ln
- 1400 Mcfarland Ave
- 1400 Mcfarland Ave
- 10 Carroll Ln Unit 2
- 12 Carroll Ln
- 8 Carroll Ln
- 1 Carroll Ln Unit 2
- 1 Carroll Ln
- 2 E Wotring St
- 100 James St Unit B