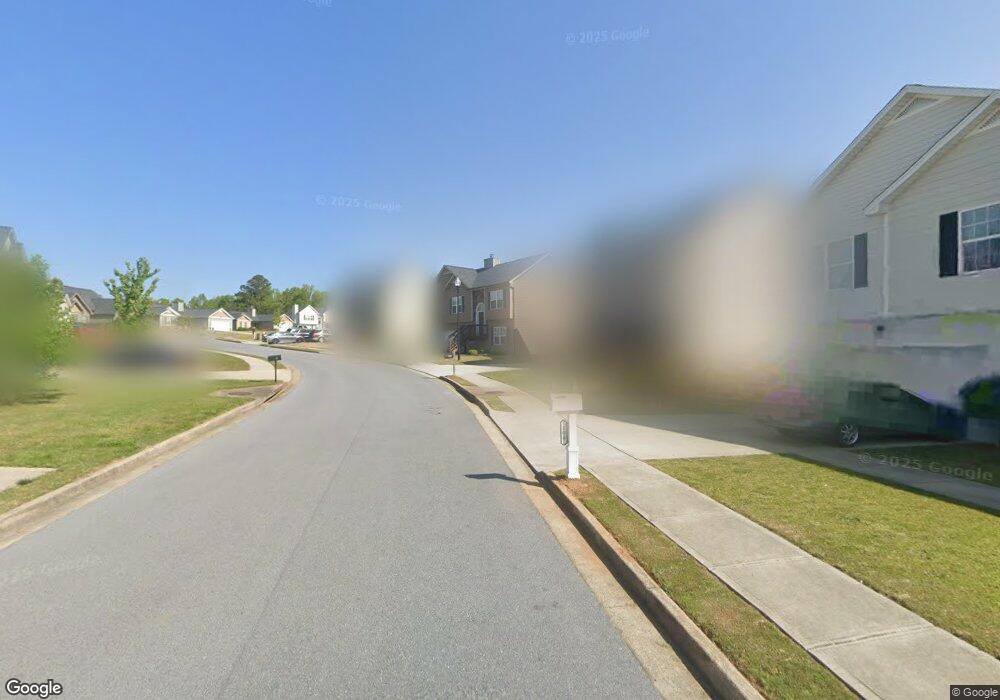
108 Andrews Ct Dallas, GA 30157
Estimated Value: $299,320 - $333,000
3
Beds
2
Baths
1,254
Sq Ft
$249/Sq Ft
Est. Value
About This Home
This home is located at 108 Andrews Ct, Dallas, GA 30157 and is currently estimated at $312,580, approximately $249 per square foot. 108 Andrews Ct is a home with nearby schools including Allgood Elementary School, Herschel Jones Middle School, and Paulding County High School.
Ownership History
Date
Name
Owned For
Owner Type
Purchase Details
Closed on
Oct 8, 2014
Sold by
Brushy Mountain Property Manag
Bought by
Coley Thomas
Current Estimated Value
Home Financials for this Owner
Home Financials are based on the most recent Mortgage that was taken out on this home.
Original Mortgage
$139,945
Outstanding Balance
$107,485
Interest Rate
4.15%
Mortgage Type
VA
Estimated Equity
$205,095
Purchase Details
Closed on
Sep 10, 2014
Sold by
Eubanks Clark
Bought by
Brushy Mountain Property Manag
Home Financials for this Owner
Home Financials are based on the most recent Mortgage that was taken out on this home.
Original Mortgage
$139,945
Outstanding Balance
$107,485
Interest Rate
4.15%
Mortgage Type
VA
Estimated Equity
$205,095
Purchase Details
Closed on
Jun 26, 2014
Sold by
Cochran Jimmy Shane
Bought by
Eubanks Clark
Purchase Details
Closed on
Jun 10, 2014
Sold by
Seaboard Ventures Llc
Bought by
Cochran Jimmy Shane
Create a Home Valuation Report for This Property
The Home Valuation Report is an in-depth analysis detailing your home's value as well as a comparison with similar homes in the area
Home Values in the Area
Average Home Value in this Area
Purchase History
| Date | Buyer | Sale Price | Title Company |
|---|---|---|---|
| Coley Thomas | $137,000 | -- | |
| Brushy Mountain Property Manag | -- | -- | |
| Eubanks Clark | -- | -- | |
| Cochran Jimmy Shane | $80,265 | -- |
Source: Public Records
Mortgage History
| Date | Status | Borrower | Loan Amount |
|---|---|---|---|
| Open | Coley Thomas | $139,945 |
Source: Public Records
Tax History Compared to Growth
Tax History
| Year | Tax Paid | Tax Assessment Tax Assessment Total Assessment is a certain percentage of the fair market value that is determined by local assessors to be the total taxable value of land and additions on the property. | Land | Improvement |
|---|---|---|---|---|
| 2024 | $3,737 | $122,336 | $12,000 | $110,336 |
| 2023 | $3,815 | $128,320 | $12,000 | $116,320 |
| 2022 | $2,602 | $101,672 | $12,000 | $89,672 |
| 2021 | $2,256 | $79,508 | $8,000 | $71,508 |
| 2020 | $2,398 | $72,432 | $8,000 | $64,432 |
| 2019 | $2,338 | $69,800 | $8,000 | $61,800 |
| 2018 | $1,821 | $62,320 | $8,000 | $54,320 |
| 2017 | $2,021 | $59,856 | $8,000 | $51,856 |
| 2016 | $1,808 | $54,172 | $8,000 | $46,172 |
| 2015 | $1,502 | $50,656 | $8,000 | $42,656 |
| 2014 | $40 | $1,280 | $1,280 | $0 |
| 2013 | -- | $1,280 | $1,280 | $0 |
Source: Public Records
Map
Nearby Homes
- 306 Station Dr
- 218 Depot Ln
- 512 Oak View Ln
- 510 Oak View Ln
- 59 Santa Cruz Ct Unit 11
- 59 Santa Cruz Ct
- 508 Oak View Ln
- 62 Santa Cruz Ct Unit 12
- 62 Santa Cruz Ct
- 55 Santa Cruz Ct Unit 9
- 55 Santa Cruz Ct
- 309 Shawnee Trail Unit 17
- 309 Shawnee Trail
- 315 Shawnee Trail Unit 18
- 315 Shawnee Trail
- 302 Ivy Brook Dr
- 409 Ivy Terrace Dr
- 0 Santa Cruz Ct Unit LOT 7 10506627
- 0 Santa Cruz Ct Unit 7565435
- 500 Oak View Ln
- 0 Andrews Ct Unit 8436072
- 0 Andrews Ct Unit 8359431
- 0 Andrews Ct Unit 8712065
- 0 Andrews Ct Unit 8477640
- 0 Andrews Ct Unit 9067456
- 0 Andrews Ct Unit 8840580
- 0 Andrews Ct Unit 8930513
- 0 Andrews Ct
- 110 Andrews Ct
- 107 Andrews Ct
- 104 Andrews Ct Unit 41
- 104 Andrews Ct
- 109 Andrews Ct
- 112 Andrews Ct
- 106 Flagler Way
- 104 Flagler Way
- 108 Flagler Way
- 110 Flagler Way
- 0 Flagler Way Unit 8538655
- 0 Flagler Way Unit 8963324