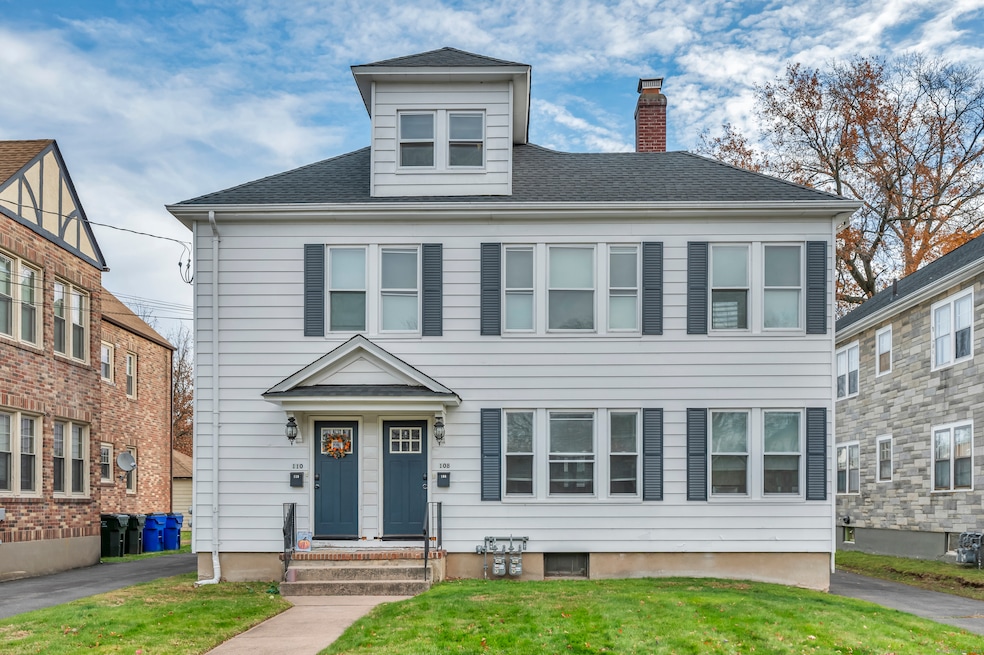
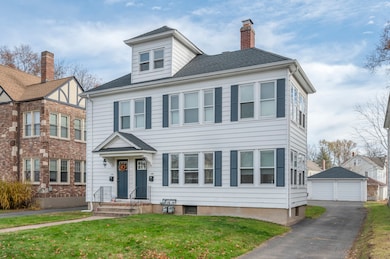
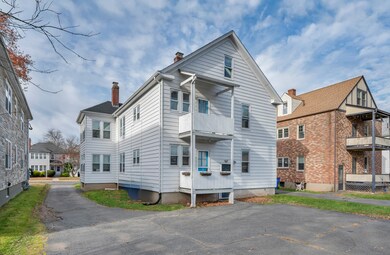
108 Ardmore Rd West Hartford, CT 06119
Highlights
- 1 Fireplace
- Breakfast Area or Nook
- Hot Water Heating System
- Morley School Rated A-
- Tankless Water Heater
- Level Lot
About This Home
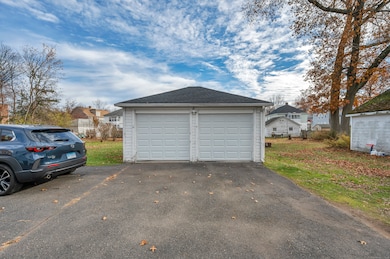
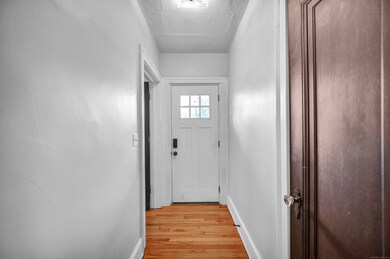
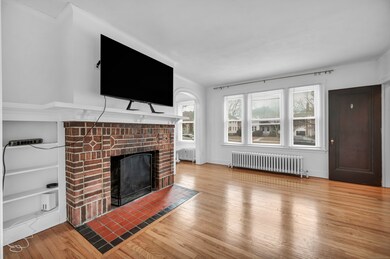
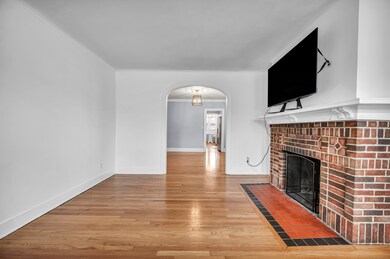
Clean and comfortable first-floor unit just minutes from West Hartford Center and Blue Back Square. The living room features a wood-burning fireplace and opens to an updated kitchen with granite countertops, stainless steel appliances, and a breakfast nook with built-in seating. There are two good-sized bedrooms, a full bathroom, and a bright room that works well as an office or reading room. The unit has its own in-unit washer and dryer (not shared), newer mechanicals including gas heat and a tankless water heater, a detached garage with electricity, ample driveway parking, and water included in the rent.
Listing Agent
Berkshire Hathaway NE Prop. Brokerage Phone: (860) 899-9465 License #RES.0830787 Listed on: 11/21/2025

Home Details
Home Type
- Single Family
Est. Annual Taxes
- $12,567
Year Built
- Built in 1928
Lot Details
- 9,583 Sq Ft Lot
- Level Lot
- Property is zoned RM-3R
Interior Spaces
- 1,456 Sq Ft Home
- 1 Fireplace
- Crawl Space
Kitchen
- Breakfast Area or Nook
- Gas Cooktop
- Microwave
- Dishwasher
Bedrooms and Bathrooms
- 2 Bedrooms
- 1 Full Bathroom
Laundry
- Dryer
- Washer
Parking
- 1 Car Garage
- Driveway
Schools
- Morley Elementary School
- Hall High School
Utilities
- Hot Water Heating System
- Heating System Uses Natural Gas
- Tankless Water Heater
- Hot Water Circulator
Community Details
- No Pets Allowed
Listing and Financial Details
- Assessor Parcel Number 1890990
Map
Source: SmartMLS
MLS Number: 24141567
APN: WHAR-000008G-000101-000108
Disclaimer: Certain information contained herein is derived from information provided by parties other than Homes.com. All information provided is deemed reliable, but is not guaranteed to be accurate and should be independently verified.
![]() IDX information is provided exclusively for personal, non-commercial use, and may not be used for any purpose other than to identify prospective properties consumers may be interested in purchasing. Information is deemed reliable but not guaranteed.
IDX information is provided exclusively for personal, non-commercial use, and may not be used for any purpose other than to identify prospective properties consumers may be interested in purchasing. Information is deemed reliable but not guaranteed.
- 105 Ardmore Rd
- 54 Robin Rd Unit B2
- 1110 Trout Brook Dr
- 1196 Trout Brook Dr
- 16 Lilley Rd
- 869 Farmington Ave Unit 305
- 48 Walkley Rd
- 1006A Trout Brook Dr Unit 1006A
- 30 Outlook Ave Unit 205
- 183 Loomis Dr Unit 109
- 237 Fern St Unit 314
- 1268 Trout Brook Dr
- 132 N Main St
- 1272 Trout Brook Dr
- 129 Middlebrook Rd
- 1294 Trout Brook Dr
- 85 Memorial Rd Unit 512
- 2 Arapahoe Rd Unit 313
- 2 Arapahoe Rd Unit 308
- 2 Arapahoe Rd Unit 611
- 51 Bretton Rd Unit Second Floor
- 117 Dover Rd
- 135 Dover Rd
- 1110 Trout Brook Dr
- 806-816 Farmington Ave
- 843 Farmington Ave
- 27 Walkley Rd
- 5A Robin Rd Unit 5A
- 893 Farmington Ave Unit 4F
- 893 Farmington Ave Unit 4I
- 30 Outlook Ave Unit 208
- 133 Loomis Dr
- 39 Maplewood Ave
- 62 Quaker Ln S
- 39 Outlook Ave
- 91 Maplewood Ave Unit 3
- 91 Maplewood Ave Unit 2
- 27 Loomis Dr
- 920 Farmington Ave Unit 312
- 920 Farmington Ave Unit 304