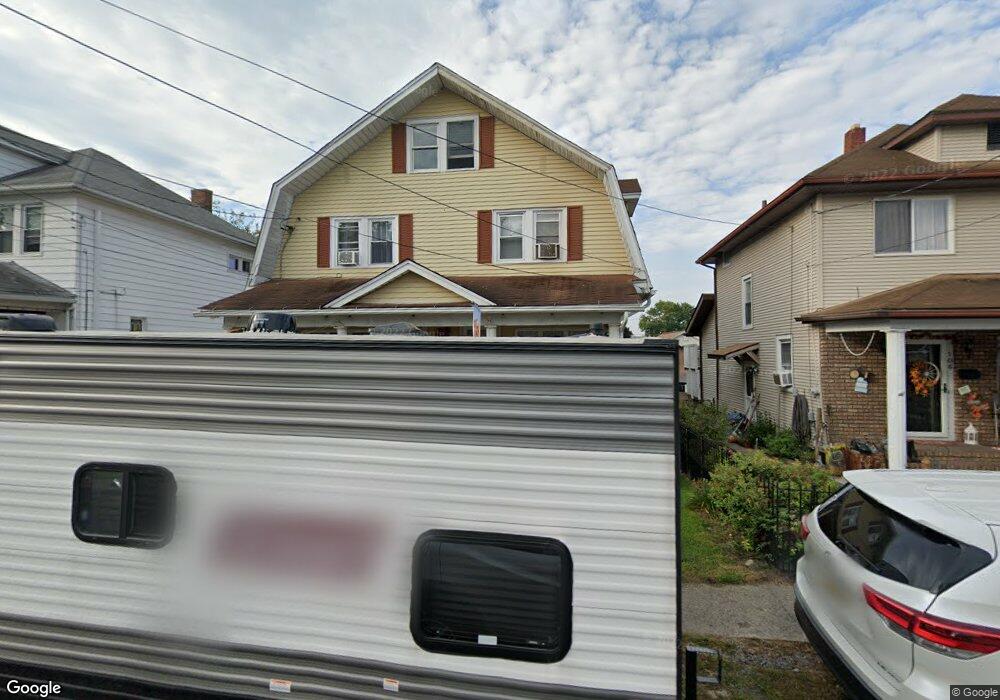
108 Barton St Unit 110 Dunmore, PA 18512
Estimated Value: $255,000 - $276,000
3
Beds
1
Bath
2,040
Sq Ft
$130/Sq Ft
Est. Value
About This Home
This home is located at 108 Barton St Unit 110, Dunmore, PA 18512 and is currently estimated at $265,390, approximately $130 per square foot. 108 Barton St Unit 110 is a home located in Lackawanna County with nearby schools including Dunmore Elementary Center, St. Mary of Mount Carmel School, and St Clare/St Paul School.
Ownership History
Date
Name
Owned For
Owner Type
Purchase Details
Closed on
Aug 3, 2017
Sold by
Jones David John and Barone Kristen Lynn
Bought by
Fortese Mark and Zilla Amanda
Current Estimated Value
Home Financials for this Owner
Home Financials are based on the most recent Mortgage that was taken out on this home.
Original Mortgage
$133,536
Outstanding Balance
$115,733
Interest Rate
5.5%
Mortgage Type
FHA
Estimated Equity
$149,657
Purchase Details
Closed on
Apr 22, 2010
Sold by
Barone Richard C and Barone Lynn M
Bought by
Jones David John and Barone Kristen Lynn
Home Financials for this Owner
Home Financials are based on the most recent Mortgage that was taken out on this home.
Original Mortgage
$112,000
Interest Rate
5%
Mortgage Type
Commercial
Purchase Details
Closed on
Dec 23, 2005
Sold by
Barone Joseph Angelo and Barone Dorothy L
Bought by
Barone Joseph A and Barone Dorothy L
Create a Home Valuation Report for This Property
The Home Valuation Report is an in-depth analysis detailing your home's value as well as a comparison with similar homes in the area
Home Values in the Area
Average Home Value in this Area
Purchase History
| Date | Buyer | Sale Price | Title Company |
|---|---|---|---|
| Fortese Mark | -- | None Available | |
| Jones David John | $140,000 | None Available | |
| Barone Joseph A | -- | None Available |
Source: Public Records
Mortgage History
| Date | Status | Borrower | Loan Amount |
|---|---|---|---|
| Open | Fortese Mark | $133,536 | |
| Previous Owner | Jones David John | $112,000 |
Source: Public Records
Tax History Compared to Growth
Tax History
| Year | Tax Paid | Tax Assessment Tax Assessment Total Assessment is a certain percentage of the fair market value that is determined by local assessors to be the total taxable value of land and additions on the property. | Land | Improvement |
|---|---|---|---|---|
| 2025 | $3,283 | $11,000 | $1,550 | $9,450 |
| 2024 | $2,807 | $11,000 | $1,550 | $9,450 |
| 2023 | $2,807 | $11,000 | $1,550 | $9,450 |
| 2022 | $2,633 | $11,000 | $1,550 | $9,450 |
| 2021 | $2,580 | $11,000 | $1,550 | $9,450 |
| 2020 | $2,580 | $11,000 | $1,550 | $9,450 |
| 2019 | $2,468 | $11,000 | $1,550 | $9,450 |
| 2018 | $2,427 | $11,000 | $1,550 | $9,450 |
| 2017 | $2,357 | $11,000 | $1,550 | $9,450 |
| 2016 | $1,242 | $11,000 | $1,550 | $9,450 |
| 2015 | -- | $11,000 | $1,550 | $9,450 |
| 2014 | -- | $11,000 | $1,550 | $9,450 |
Source: Public Records
Map
Nearby Homes
- 307 W Drinker St
- 201 Church St
- 1717 Clay Ave
- 225, 233 E 301 East Drinker Stret
- 213 N Apple St
- 1715 Quincy Ave
- 314 E Drinker St
- 1599 Electric St
- 219 E Elm St
- 1515 Marion St
- 1506 Madison Ave
- 627 S Blakely St
- 427 E Warren St
- 141 Walnut St
- 1207 N Webster Ave
- 1306 Marion St
- 1420 College Ave
- 521 6th St
- 310 W Elm St
- 322 Oak St
- 108-110 Barton St
- 110 Barton St
- 106 Barton St
- 112 Barton St
- 104 Barton St
- 114 Barton St
- 113 Barton St Unit 115
- 2015 Delaware St
- 0 Barton St Unit GSB009413
- 109 Barton St
- 2013 Delaware St
- 2019 Delaware St
- 102 Barton St
- 107 Barton St
- 2011 Delaware St
- 116 Barton St
- 116 Barton St
- 105 Barton St
- 117 Barton St
- 2021 Delaware St