Estimated Value: $223,335 - $261,000
--
Bed
2
Baths
1,893
Sq Ft
$130/Sq Ft
Est. Value
About This Home
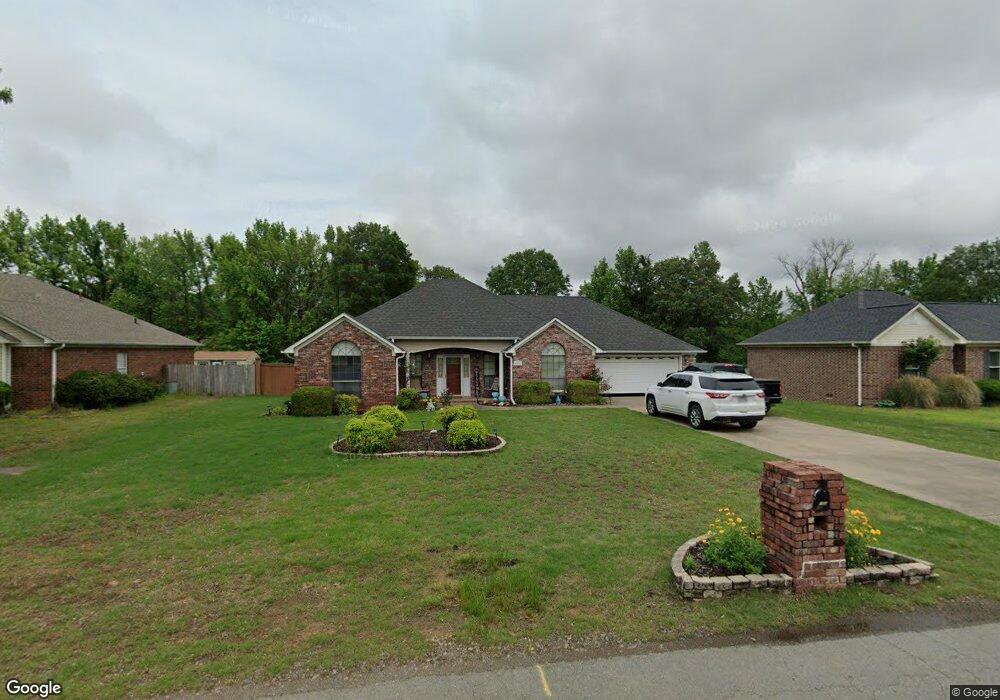
This home is located at 108 Birchwood Cir, Cabot, AR 72023 and is currently estimated at $246,834, approximately $130 per square foot. 108 Birchwood Cir is a home located in Lonoke County with nearby schools including Northside Elementary School, Cabot Junior High North, and Cabot Middle School North.
Ownership History
Date
Name
Owned For
Owner Type
Purchase Details
Closed on
Apr 14, 2008
Sold by
Lee Robert E and Lee Cheryl Jean
Bought by
Brown Carol A
Current Estimated Value
Home Financials for this Owner
Home Financials are based on the most recent Mortgage that was taken out on this home.
Original Mortgage
$161,397
Outstanding Balance
$102,398
Interest Rate
6%
Estimated Equity
$144,436
Purchase Details
Closed on
Apr 4, 2008
Sold by
Lee Robert E and Lee Cheryl Jean
Bought by
Brown Carol A
Home Financials for this Owner
Home Financials are based on the most recent Mortgage that was taken out on this home.
Original Mortgage
$161,397
Outstanding Balance
$102,398
Interest Rate
6%
Estimated Equity
$144,436
Purchase Details
Closed on
Jun 7, 1996
Bought by
Lee and Wife Cheryl
Purchase Details
Closed on
May 12, 1995
Bought by
Westerman Blds
Purchase Details
Closed on
Jul 5, 1994
Bought by
Final Plat C and Final 116
Create a Home Valuation Report for This Property
The Home Valuation Report is an in-depth analysis detailing your home's value as well as a comparison with similar homes in the area
Home Values in the Area
Average Home Value in this Area
Purchase History
| Date | Buyer | Sale Price | Title Company |
|---|---|---|---|
| Brown Carol A | -- | United Abstract And Title Co | |
| Brown Carol A | -- | United Abstract And Title Co | |
| Lee | $122,000 | -- | |
| Lee | $122,000 | -- | |
| Westerman Blds | $13,000 | -- | |
| Final Plat C | -- | -- |
Source: Public Records
Mortgage History
| Date | Status | Borrower | Loan Amount |
|---|---|---|---|
| Open | Brown Carol A | $161,397 | |
| Closed | Brown Carol A | $161,397 |
Source: Public Records
Tax History Compared to Growth
Tax History
| Year | Tax Paid | Tax Assessment Tax Assessment Total Assessment is a certain percentage of the fair market value that is determined by local assessors to be the total taxable value of land and additions on the property. | Land | Improvement |
|---|---|---|---|---|
| 2025 | $1,198 | $31,880 | $3,400 | $28,480 |
| 2024 | $1,198 | $31,880 | $3,400 | $28,480 |
| 2023 | $1,198 | $31,880 | $3,400 | $28,480 |
| 2022 | $1,248 | $31,880 | $3,400 | $28,480 |
| 2021 | $1,248 | $31,880 | $3,400 | $28,480 |
| 2020 | $1,216 | $31,250 | $3,400 | $27,850 |
| 2019 | $1,216 | $31,250 | $3,400 | $27,850 |
| 2018 | $1,194 | $31,250 | $3,400 | $27,850 |
| 2017 | $1,434 | $31,250 | $3,400 | $27,850 |
| 2016 | $1,194 | $31,250 | $3,400 | $27,850 |
| 2015 | $1,137 | $30,100 | $3,400 | $26,700 |
| 2014 | $1,137 | $30,100 | $3,400 | $26,700 |
Source: Public Records
Map
Nearby Homes
- 141 Birchwood Cir
- 138 Birchwood Cir
- 1017 Southhills Dr
- 05 Bradford Dr
- 02 Bradford Dr
- 04 Bradford Dr
- 09 Bradford Dr
- 03A Bradford Dr
- 08 Bradford Dr
- 03B Bradford Dr
- 07 Bradford Dr
- 12 Bradford Dr
- 01 Bradford Dr
- 06 Bradford Dr
- 10 Bradford Dr
- 11 Bradford Dr
- 02 Christian Ln
- 01 Christian Ln
- 00 Christian Ln
- 03 Christian Ln
- 106 Birchwood Cir
- 104 Birchwood Cir
- 110 Birchwood Cir
- 110 Birchwood Cir
- 11 Edgehill Cove
- 10 Edgehill Cove
- 43 Crestwood Dr
- 112 Birchwood Cir
- 13 Edgehill Cove
- 0 Edgehill Cove
- 102 Birchwood Cir
- 95 Crestwood Estates
- Lot 95 Crestwood Estates
- 41 Crestwood Dr
- 12 Edgehill Cove
- 15 Edgehill Cove
- 100 Birchwood Cir
- 39 Crestwood Dr
- 14 Edgehill Cove
- 42 Crestwood Dr