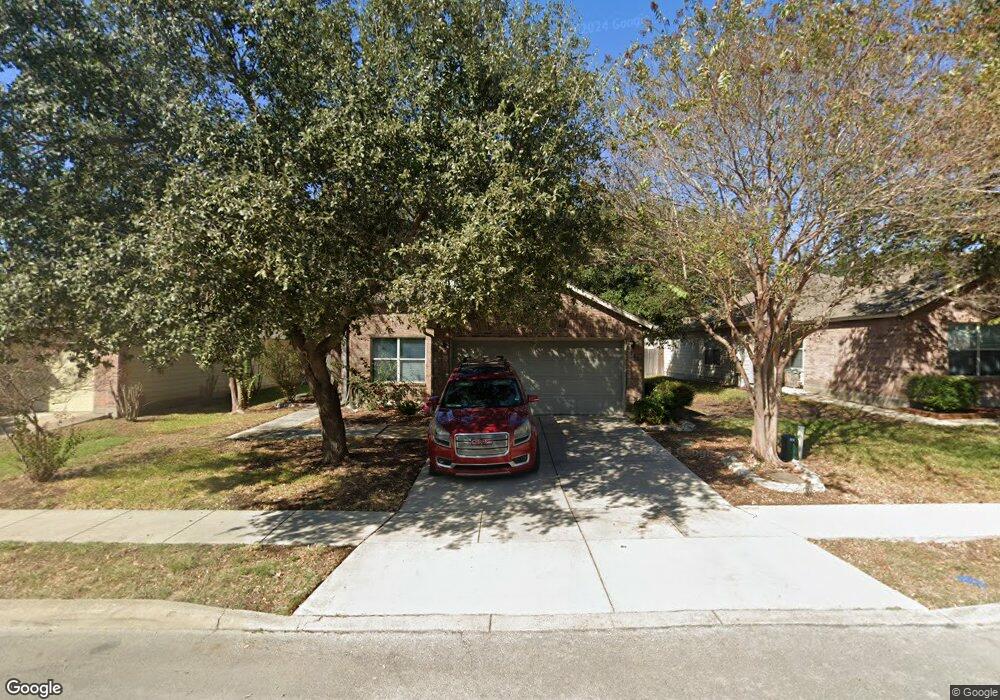
108 Brahma Way Cibolo, TX 78108
Estimated Value: $245,000 - $252,616
4
Beds
2
Baths
1,675
Sq Ft
$149/Sq Ft
Est. Value
About This Home
This home is located at 108 Brahma Way, Cibolo, TX 78108 and is currently estimated at $248,904, approximately $148 per square foot. 108 Brahma Way is a home located in Guadalupe County with nearby schools including Wiederstein Elementary School, Barbara Jordan Intermediate School, and Dobie J High School.
Ownership History
Date
Name
Owned For
Owner Type
Purchase Details
Closed on
Oct 17, 2011
Sold by
Fannie Mae
Bought by
Knight Misty
Current Estimated Value
Home Financials for this Owner
Home Financials are based on the most recent Mortgage that was taken out on this home.
Original Mortgage
$119,783
Outstanding Balance
$82,285
Interest Rate
4.25%
Mortgage Type
FHA
Estimated Equity
$166,619
Purchase Details
Closed on
Jul 5, 2011
Sold by
Chavez Filiberto and Chavez Maribel M
Bought by
Federal National Mortgage Association and Fannie Mae
Purchase Details
Closed on
Jun 30, 2006
Sold by
Grover Michael R and Grover Melissa
Bought by
Chavez Filiberto and Chavez Maribel M
Home Financials for this Owner
Home Financials are based on the most recent Mortgage that was taken out on this home.
Original Mortgage
$92,050
Interest Rate
6.67%
Mortgage Type
Purchase Money Mortgage
Create a Home Valuation Report for This Property
The Home Valuation Report is an in-depth analysis detailing your home's value as well as a comparison with similar homes in the area
Home Values in the Area
Average Home Value in this Area
Purchase History
| Date | Buyer | Sale Price | Title Company |
|---|---|---|---|
| Knight Misty | -- | Trinity Title Of Texas Llc | |
| Federal National Mortgage Association | $135,446 | None Available | |
| Chavez Filiberto | -- | Fa |
Source: Public Records
Mortgage History
| Date | Status | Borrower | Loan Amount |
|---|---|---|---|
| Open | Knight Misty | $119,783 | |
| Previous Owner | Chavez Filiberto | $92,050 |
Source: Public Records
Tax History Compared to Growth
Tax History
| Year | Tax Paid | Tax Assessment Tax Assessment Total Assessment is a certain percentage of the fair market value that is determined by local assessors to be the total taxable value of land and additions on the property. | Land | Improvement |
|---|---|---|---|---|
| 2025 | $4,165 | $245,821 | $35,907 | $209,914 |
| 2024 | $4,165 | $272,443 | $37,524 | $234,932 |
| 2023 | $4,786 | $247,675 | $45,463 | $240,368 |
| 2022 | $4,845 | $225,159 | $37,529 | $233,199 |
| 2021 | $4,666 | $204,690 | $35,640 | $182,648 |
| 2020 | $4,271 | $186,082 | $25,300 | $160,782 |
| 2019 | $4,200 | $179,520 | $25,300 | $154,220 |
| 2018 | $3,953 | $170,568 | $22,000 | $148,568 |
| 2017 | $3,216 | $173,387 | $26,180 | $147,207 |
| 2016 | $3,604 | $156,535 | $21,750 | $134,785 |
| 2015 | $3,216 | $155,621 | $21,000 | $134,621 |
| 2014 | $2,890 | $139,118 | $15,000 | $124,118 |
Source: Public Records
Map
Nearby Homes
- 120 Angus Way
- 117 Longhorn Way
- 104 Steer Ln
- 212 Anvil Place
- 224 Anvil Place
- 317 Longhorn Way
- 325 Cattle Run
- 349 Wagon Wheel Way
- 116 Harness Ln
- 157 Buckskin Way
- 228 Hereford St
- 310 Glenwood Ranch
- 318 Glenwood Ranch
- 322 Glenwood Ranch
- 228 Comanche Trail
- 105 Rhew Place
- 128 Rawhide Way
- 204 Bridle Bend
- 330 Glenwood Ranch
- 248 Fritz Way
- 104 Brahma Way
- 100 Brahma Way
- 105 Brahma Way
- 112 Brahma Way
- 109 Brahma Way
- 109 Angus Way
- 105 Angus Way
- 116 Brahma Way
- 101 Angus Way
- 113 Brahma Way
- 149 Corral Fence
- 113 Angus Way
- 145 Corral Fence
- 153 Corral Fence
- 141 Corral Fence
- 157 Corral Fence
- 117 Brahma Way
- 117 Angus Way
- 120 Brahma Way
- 137 Corral Fence