108 Callenwolde Ct Eatonton, GA 31024
Estimated Value: $2,852,000 - $3,262,436
--
Bed
6
Baths
6,658
Sq Ft
$462/Sq Ft
Est. Value
About This Home
This home is located at 108 Callenwolde Ct, Eatonton, GA 31024 and is currently estimated at $3,074,812, approximately $461 per square foot. 108 Callenwolde Ct is a home located in Putnam County with nearby schools including Putnam County Primary School, Putnam County Elementary School, and Putnam County Middle School.
Ownership History
Date
Name
Owned For
Owner Type
Purchase Details
Closed on
Jun 5, 2020
Sold by
Ferrero Terry
Bought by
Ca Oconee Properties Llc
Current Estimated Value
Purchase Details
Closed on
Jan 16, 2015
Sold by
Ferrero Terry
Bought by
Ca Oconee Properties Llc
Purchase Details
Closed on
May 31, 2011
Sold by
Ferrero Lori D
Bought by
Ferrero Terry L
Purchase Details
Closed on
Jan 4, 2002
Sold by
Hodges Marc
Bought by
Ferrero Terry L
Purchase Details
Closed on
Apr 16, 2001
Sold by
Cappai Craig
Bought by
Ferrero Terry and Ferrero Et A
Purchase Details
Closed on
Mar 21, 2000
Sold by
Bremer Gary M
Bought by
Ferrero Terry and Ferrero Et A
Purchase Details
Closed on
Aug 30, 1999
Sold by
Bremer Gary M
Bought by
Gross Stephen
Purchase Details
Closed on
Nov 25, 1998
Sold by
Ferrero Terry and Ferrero Et A
Bought by
Cappai Craig and Cappai Et A
Purchase Details
Closed on
Jun 17, 1998
Sold by
Ferrero Terry and Ferrero Et A
Bought by
Ferrero Terry and Ferrero Et A
Create a Home Valuation Report for This Property
The Home Valuation Report is an in-depth analysis detailing your home's value as well as a comparison with similar homes in the area
Home Values in the Area
Average Home Value in this Area
Purchase History
| Date | Buyer | Sale Price | Title Company |
|---|---|---|---|
| Ca Oconee Properties Llc | $1,300,000 | -- | |
| Ca Oconee Properties Llc | $1,300,000 | -- | |
| Ferrero Terry L | -- | -- | |
| Ferrero Terry L | -- | -- | |
| Ferrero Terry | -- | -- | |
| Ferrero Terry | -- | -- | |
| Gross Stephen | -- | -- | |
| Cappai Craig | -- | -- | |
| Ferrero Terry | -- | -- |
Source: Public Records
Tax History Compared to Growth
Tax History
| Year | Tax Paid | Tax Assessment Tax Assessment Total Assessment is a certain percentage of the fair market value that is determined by local assessors to be the total taxable value of land and additions on the property. | Land | Improvement |
|---|---|---|---|---|
| 2024 | $17,951 | $1,042,154 | $400,000 | $642,154 |
| 2023 | $25,673 | $1,422,308 | $800,000 | $622,308 |
| 2022 | $17,902 | $891,582 | $390,000 | $501,582 |
| 2021 | $15,336 | $673,084 | $316,250 | $356,834 |
| 2020 | $15,246 | $629,279 | $287,500 | $341,779 |
| 2019 | $15,448 | $629,061 | $287,500 | $341,561 |
| 2018 | $15,011 | $600,922 | $301,875 | $299,047 |
| 2017 | $14,108 | $625,746 | $287,500 | $338,246 |
| 2016 | $13,806 | $611,634 | $287,500 | $324,134 |
| 2015 | $13,248 | $608,974 | $287,500 | $321,474 |
| 2014 | $14,199 | $651,763 | $299,000 | $352,763 |
Source: Public Records
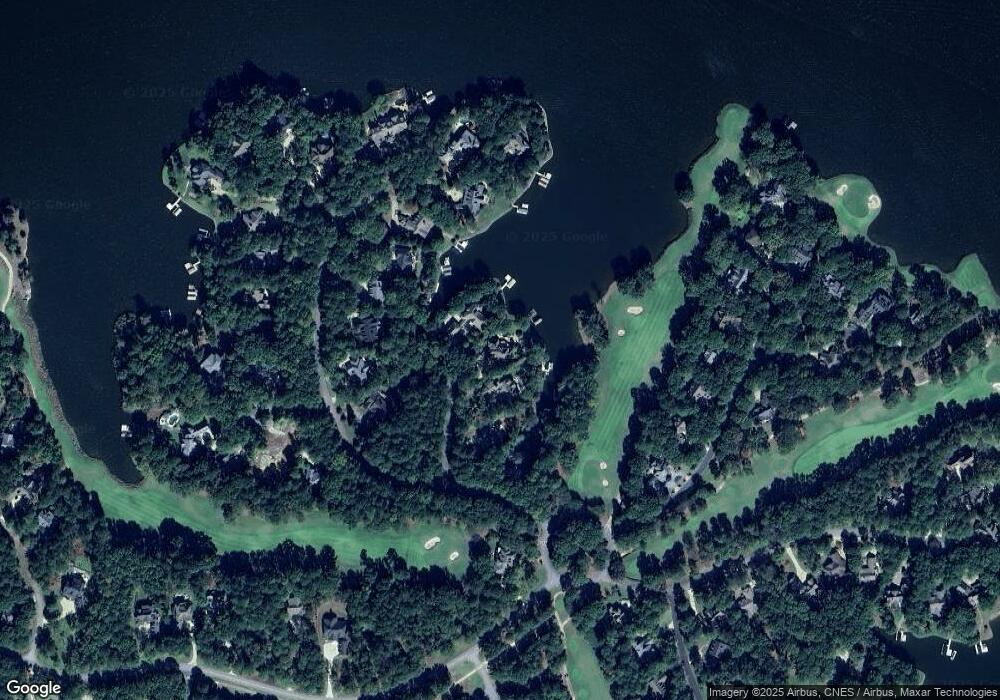
Map
Nearby Homes
- 129 Barrington Hall Dr
- 133 Ashland Place
- 140 Winnstead Place
- 108 Porterfield Dr
- 112 Porterfield Dr
- 108 Camak Place
- 105 Porterfield Dr
- 120 Camak Place
- 124 Oakton N
- 106 Oakton N
- 149 Carolyn Dr
- 117 Westview Way
- 1101 Timothy Rd
- 1060 Liberty Bluff Ct
- 1441 Bennett Springs Dr
- 112 Carolyn Dr
- 1120 Plantation Point Dr
- 1201 Marina Cove Ln
- 112 Callenwolde Ct
- 112 Callenwolde Ct Unit 158
- 104 Callenwolde Ct
- 104 Callenwolde Ct
- 100 Callenwolde Ct
- 1117 Altama Ct
- 100 Barrington Hall Dr
- 124 Barrington Hall Dr
- 128 Barrington Hall Dr
- 120 Barrington Hall Dr
- 140 Barrington Hall Dr
- 144 Barrington Hall Dr
- 132 Barrington Hall Dr
- 0 Barrington Hall Dr Unit 8586983
- 0 Barrington Hall Dr Unit 8380392
- 0 Barrington Hall Dr Unit 8062274
- 0 Barrington Hall Dr Unit 7571913
- 0 Barrington Hall Dr Unit 7466839
- 0 Barrington Hall Dr Unit 7267627
- 0 Barrington Hall Dr Unit 8343042