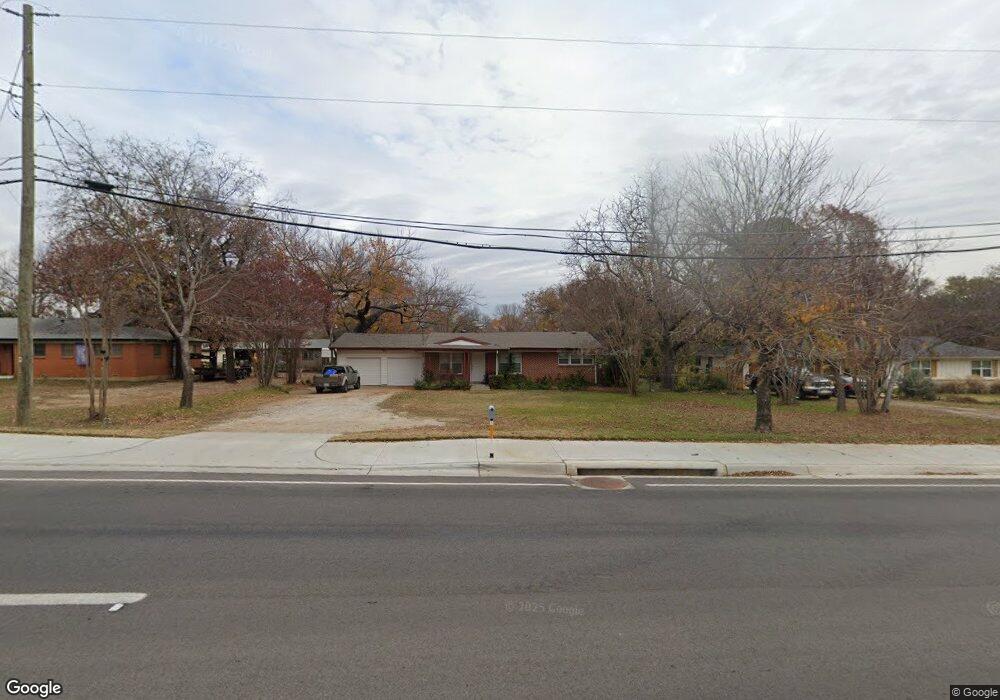
108 Cheek Sparger Rd Colleyville, TX 76034
Estimated Value: $492,000 - $812,000
3
Beds
2
Baths
1,348
Sq Ft
$432/Sq Ft
Est. Value
About This Home
This home is located at 108 Cheek Sparger Rd, Colleyville, TX 76034 and is currently estimated at $582,641, approximately $432 per square foot. 108 Cheek Sparger Rd is a home located in Tarrant County with nearby schools including Bransford Elementary School, Colleyville Middle School, and Grapevine High School.
Ownership History
Date
Name
Owned For
Owner Type
Purchase Details
Closed on
Sep 14, 2018
Sold by
Bmw Properties Inc
Bought by
J W 777 Revocable Family Trust
Current Estimated Value
Purchase Details
Closed on
Aug 23, 2018
Sold by
Burnham Angela
Bought by
Bmw Properties Inc
Purchase Details
Closed on
Apr 8, 2009
Sold by
Clark Drew L and Burnham Angela Rose
Bought by
Harris D Keith
Home Financials for this Owner
Home Financials are based on the most recent Mortgage that was taken out on this home.
Original Mortgage
$66,720
Interest Rate
5.24%
Mortgage Type
Purchase Money Mortgage
Purchase Details
Closed on
May 27, 1994
Sold by
Blevins Frances Martin and Price Minneta Martin
Bought by
Johnson James R and Johnson Ouida R
Home Financials for this Owner
Home Financials are based on the most recent Mortgage that was taken out on this home.
Original Mortgage
$44,800
Interest Rate
8.45%
Create a Home Valuation Report for This Property
The Home Valuation Report is an in-depth analysis detailing your home's value as well as a comparison with similar homes in the area
Home Values in the Area
Average Home Value in this Area
Purchase History
| Date | Buyer | Sale Price | Title Company |
|---|---|---|---|
| J W 777 Revocable Family Trust | -- | None Available | |
| Bmw Properties Inc | -- | Texas Title | |
| Harris D Keith | -- | Rattikin Title | |
| Johnson James R | -- | Rattikin Title Co |
Source: Public Records
Mortgage History
| Date | Status | Borrower | Loan Amount |
|---|---|---|---|
| Previous Owner | Harris D Keith | $66,720 | |
| Previous Owner | Johnson James R | $44,800 |
Source: Public Records
Tax History Compared to Growth
Tax History
| Year | Tax Paid | Tax Assessment Tax Assessment Total Assessment is a certain percentage of the fair market value that is determined by local assessors to be the total taxable value of land and additions on the property. | Land | Improvement |
|---|---|---|---|---|
| 2025 | $2,091 | $356,795 | $278,305 | $78,490 |
| 2024 | $2,091 | $433,477 | $278,305 | $155,172 |
| 2023 | $6,397 | $379,218 | $278,305 | $100,913 |
| 2022 | $6,518 | $330,000 | $278,305 | $51,695 |
| 2021 | $6,047 | $275,339 | $206,610 | $68,729 |
| 2020 | $6,118 | $275,339 | $206,610 | $68,729 |
| 2019 | $6,366 | $275,339 | $206,610 | $68,729 |
| 2018 | $556 | $93,530 | $53,416 | $40,114 |
| 2017 | $2,009 | $273,645 | $206,610 | $67,035 |
| 2016 | $1,826 | $269,885 | $203,610 | $66,275 |
| 2015 | $1,430 | $70,270 | $35,000 | $35,270 |
| 2014 | $1,430 | $70,270 | $35,000 | $35,270 |
Source: Public Records
Map
Nearby Homes
- 3713 Brentwood Ct
- 2732 Woodbridge Dr
- 2620 Brookridge Dr
- 405 Woodbriar Ct
- 312 Bremen Dr
- 405 Bremen Dr
- 305 Warbler Dr
- 628 Huntwich Dr
- 2844 Hurstview Dr
- 4600 Bransford Rd
- 2809 Sandstone Dr
- 320 Blue Quail Ct
- 404 Heather Ln
- 2804 Ridgewood Dr
- 2829 Sandstone Dr
- 3605 Spring Valley Dr
- 909 Brestol Ct W
- 2668 Bent Tree Dr
- 2244 Hurstview Dr
- 712 Springwood Dr
- 104 Cheek Sparger Rd
- 112 Cheek Sparger Rd
- 116 Cheek Sparger Rd
- 100 Cheek Sparger Rd
- 100 Cheek Sparger Rd
- 100 Cheek Sparger Rd Unit 102
- 120 Cheek Sparger Rd
- 200 Cheek Sparger Rd
- 119 Cheek Sparger Rd
- 102 Cheek-Sparger Rd
- 4007 Colleyville Blvd
- 124 Cheek Sparger Rd
- 124 Cheek-Sparger Rd
- 121 Acuff Ln
- 123 Cheek Sparger Rd
- 128 Cheek Sparger Rd
- 123 Acuff Ln
- 125 Acuff Ln
- 3901 Colleyville Blvd
- 3901 Colleyville Blvd Unit 104 A