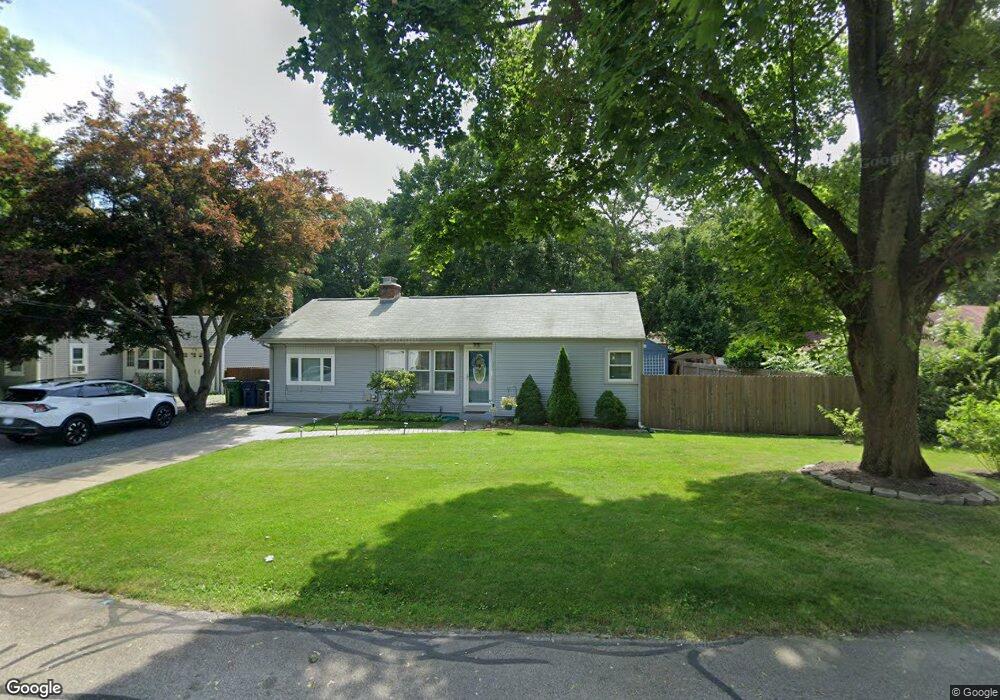
108 Circuit Dr Warwick, RI 02889
Conimicut-Shawomet NeighborhoodEstimated Value: $314,000 - $403,000
2
Beds
1
Bath
1,000
Sq Ft
$369/Sq Ft
Est. Value
About This Home
This home is located at 108 Circuit Dr, Warwick, RI 02889 and is currently estimated at $368,591, approximately $368 per square foot. 108 Circuit Dr is a home located in Kent County with nearby schools including Saint Kevin School, St. Peter School, and Bishop Hendricken High School.
Ownership History
Date
Name
Owned For
Owner Type
Purchase Details
Closed on
May 22, 2025
Sold by
Rainville Michael L
Bought by
Michael L Rainville Relt
Current Estimated Value
Purchase Details
Closed on
Nov 30, 2020
Sold by
Rainville Anthony M
Bought by
Rainville Michael L
Purchase Details
Closed on
May 3, 2010
Sold by
Relativity Llc
Bought by
Rainville Anthony M
Home Financials for this Owner
Home Financials are based on the most recent Mortgage that was taken out on this home.
Original Mortgage
$164,465
Interest Rate
4.99%
Mortgage Type
Purchase Money Mortgage
Purchase Details
Closed on
Dec 10, 2009
Sold by
Aragao Jason
Bought by
Relativity Llc
Purchase Details
Closed on
Apr 9, 2009
Sold by
Moore Jean A and Bank Of New York Mello
Bought by
Bank Of New York Mello
Purchase Details
Closed on
Nov 12, 1997
Sold by
Donnelly Francis T and Donnelly Linda
Bought by
Moore Kenneth L and Moore Jean
Create a Home Valuation Report for This Property
The Home Valuation Report is an in-depth analysis detailing your home's value as well as a comparison with similar homes in the area
Home Values in the Area
Average Home Value in this Area
Purchase History
| Date | Buyer | Sale Price | Title Company |
|---|---|---|---|
| Michael L Rainville Relt | -- | None Available | |
| Michael L Rainville Relt | -- | None Available | |
| Rainville Michael L | $200,000 | None Available | |
| Rainville Michael L | $200,000 | None Available | |
| Rainville Anthony M | $167,500 | -- | |
| Rainville Anthony M | $167,500 | -- | |
| Relativity Llc | -- | -- | |
| Aragao Jason | $101,975 | -- | |
| Aragao Jason | $101,975 | -- | |
| Bank Of New York Mello | $220,085 | -- | |
| Bank Of New York Mello | $220,085 | -- | |
| Moore Kenneth L | $79,000 | -- | |
| Moore Kenneth L | $79,000 | -- |
Source: Public Records
Mortgage History
| Date | Status | Borrower | Loan Amount |
|---|---|---|---|
| Previous Owner | Moore Kenneth L | $164,465 |
Source: Public Records
Tax History Compared to Growth
Tax History
| Year | Tax Paid | Tax Assessment Tax Assessment Total Assessment is a certain percentage of the fair market value that is determined by local assessors to be the total taxable value of land and additions on the property. | Land | Improvement |
|---|---|---|---|---|
| 2025 | $4,489 | $353,500 | $107,900 | $245,600 |
| 2024 | $3,658 | $252,800 | $89,100 | $163,700 |
| 2023 | $3,587 | $252,800 | $89,100 | $163,700 |
| 2022 | $3,218 | $171,800 | $49,200 | $122,600 |
| 2021 | $3,218 | $171,800 | $49,200 | $122,600 |
| 2020 | $3,218 | $171,800 | $49,200 | $122,600 |
| 2019 | $3,218 | $171,800 | $49,200 | $122,600 |
| 2018 | $2,839 | $136,500 | $49,200 | $87,300 |
| 2017 | $2,763 | $136,500 | $49,200 | $87,300 |
| 2016 | $2,763 | $136,500 | $49,200 | $87,300 |
| 2015 | $2,708 | $130,500 | $57,000 | $73,500 |
| 2014 | $2,618 | $130,500 | $57,000 | $73,500 |
| 2013 | $2,583 | $130,500 | $57,000 | $73,500 |
Source: Public Records
Map
Nearby Homes
- 400 Cole Farm Rd
- 100 Aurora Dr
- 107 Glenwood Dr
- 12 Lima St
- 161 W Shore Rd Unit B5
- 600 Cole Farm Rd
- 73 Eton Ave
- 26 Dallas Ave
- 41 Dayton Ave
- 72 W Shore Rd Unit 3
- 72 W Shore Rd Unit 104
- 78 Jennie Ln
- 6 Black Creek Ln
- 32 Omaha Blvd
- 165 Merrymount Dr
- 40 Cavalcade Blvd
- 41 Recess Ln
- 176 Vernon St
- 33 Recess Ln
- 355 Church Ave