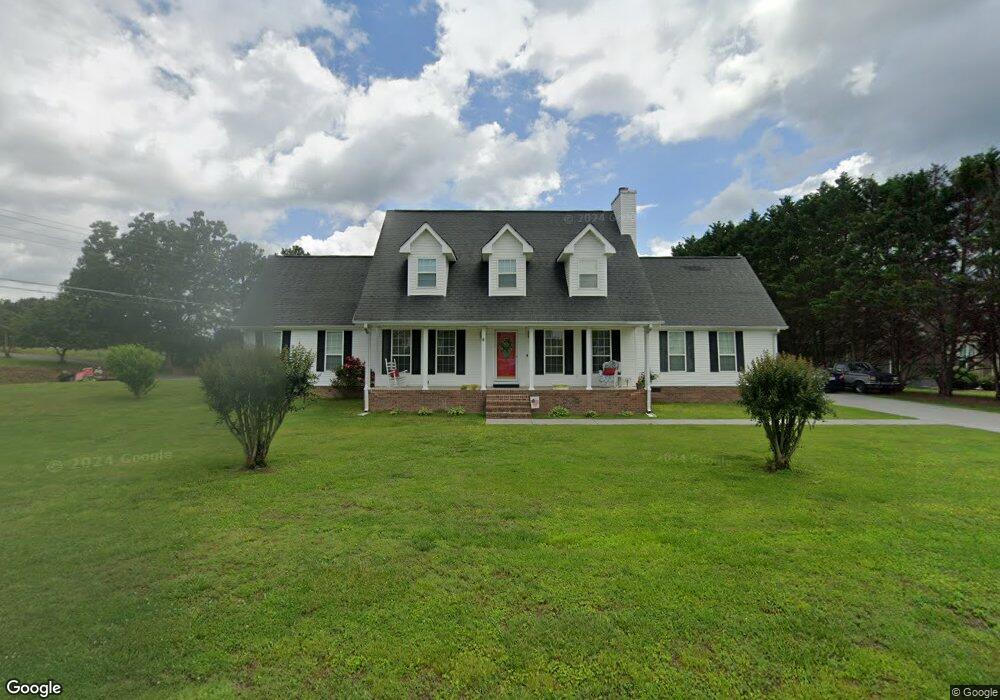
108 Clifton Ct SE Calhoun, GA 30701
Estimated Value: $351,555 - $392,000
4
Beds
3
Baths
2,336
Sq Ft
$159/Sq Ft
Est. Value
About This Home
This home is located at 108 Clifton Ct SE, Calhoun, GA 30701 and is currently estimated at $370,889, approximately $158 per square foot. 108 Clifton Ct SE is a home located in Gordon County with nearby schools including Sonoraville Elementary School, Red Bud Middle School, and Sonoraville High School.
Ownership History
Date
Name
Owned For
Owner Type
Purchase Details
Closed on
Nov 10, 2022
Sold by
Hicks William Bruce
Bought by
Franklin James R and Franklin Debra A
Current Estimated Value
Home Financials for this Owner
Home Financials are based on the most recent Mortgage that was taken out on this home.
Original Mortgage
$299,250
Outstanding Balance
$290,189
Interest Rate
7.08%
Mortgage Type
New Conventional
Estimated Equity
$80,700
Purchase Details
Closed on
Sep 9, 2022
Sold by
Morgan Willene Estate
Bought by
Hicks William Bruce and Lovingood Randall
Purchase Details
Closed on
Apr 26, 2001
Sold by
Sexton Doug
Bought by
Morgan Willene
Purchase Details
Closed on
Oct 6, 2000
Sold by
Dixon David and Dixon Georgann
Bought by
Sexton Doug
Purchase Details
Closed on
Feb 25, 1998
Bought by
Dixon David and Dixon Georgann
Purchase Details
Closed on
Sep 15, 1993
Bought by
Keen Development Inc
Create a Home Valuation Report for This Property
The Home Valuation Report is an in-depth analysis detailing your home's value as well as a comparison with similar homes in the area
Home Values in the Area
Average Home Value in this Area
Purchase History
| Date | Buyer | Sale Price | Title Company |
|---|---|---|---|
| Franklin James R | $315,000 | -- | |
| Hicks William Bruce | $225,000 | -- | |
| Morgan Willene | -- | -- | |
| Sexton Doug | $45,000 | -- | |
| Dixon David | -- | -- | |
| Keen Development Inc | -- | -- |
Source: Public Records
Mortgage History
| Date | Status | Borrower | Loan Amount |
|---|---|---|---|
| Open | Franklin James R | $299,250 |
Source: Public Records
Tax History Compared to Growth
Tax History
| Year | Tax Paid | Tax Assessment Tax Assessment Total Assessment is a certain percentage of the fair market value that is determined by local assessors to be the total taxable value of land and additions on the property. | Land | Improvement |
|---|---|---|---|---|
| 2024 | $3,362 | $134,320 | $6,800 | $127,520 |
| 2023 | $3,126 | $125,040 | $6,800 | $118,240 |
| 2022 | $1,054 | $104,480 | $6,800 | $97,680 |
| 2021 | $796 | $85,680 | $6,800 | $78,880 |
| 2020 | $800 | $85,400 | $5,600 | $79,800 |
| 2019 | $803 | $85,400 | $5,600 | $79,800 |
| 2018 | $809 | $85,960 | $5,600 | $80,360 |
| 2017 | $778 | $81,200 | $5,600 | $75,600 |
| 2016 | $713 | $74,400 | $5,600 | $68,800 |
| 2015 | $705 | $72,960 | $5,600 | $67,360 |
| 2014 | $662 | $69,956 | $5,600 | $64,356 |
Source: Public Records
Map
Nearby Homes
- 166 Woodford Way SE
- 190 Woodford Way SE
- 145 Water Wheel Ln SE
- 135 Grist Mill Ln SE
- 140 Grist Mill Ln SE
- 311 Langston Rd SE
- 137 Hunters Trail SE
- 172 Hunters Trail SE
- 140 Chestnut Ln SE
- 157 Asbury Cir
- 478 Oakland Dr SE
- 3171 Dews Pond Rd SE
- Grand Bahama Plan at Heritage Grove - 2-Story
- Anderson Plan at Heritage Grove - 2-Story
- Aruba Bay Plan at Heritage Grove - 2-Story
- Allegheny Plan at Heritage Grove - 2-Story
- Hudson Plan at Heritage Grove - 2-Story
- Eden Cay Plan at Heritage Grove - 2-Story
- Ballenger Plan at Heritage Grove - 2-Story
- 106 Valley View Cir SE
- 0 Clifton Ct
- 120 Clifton Ct SE
- 101 Clifton Ct SE
- 111 Clifton Ct SE
- 121 Clifton Ct SE
- 130 Clifton Ct SE
- 131 Clifton Ct SE
- 131 Clifton Ct SE
- 120 Beason Rd SE
- 2124 Boone Ford Rd SE
- 107 Greystone Dr SE
- 110 Beason Rd SE
- 152 Hanover Cir SE
- 123 Greystone Dr SE
- 128 Hanover Cir SE
- 156 Hanover Cir SE
- 135 Greystone Dr SE
- 140 Beason Rd SE
- 2075 Boone Ford Rd SE
- 110 Greystone Dr SE