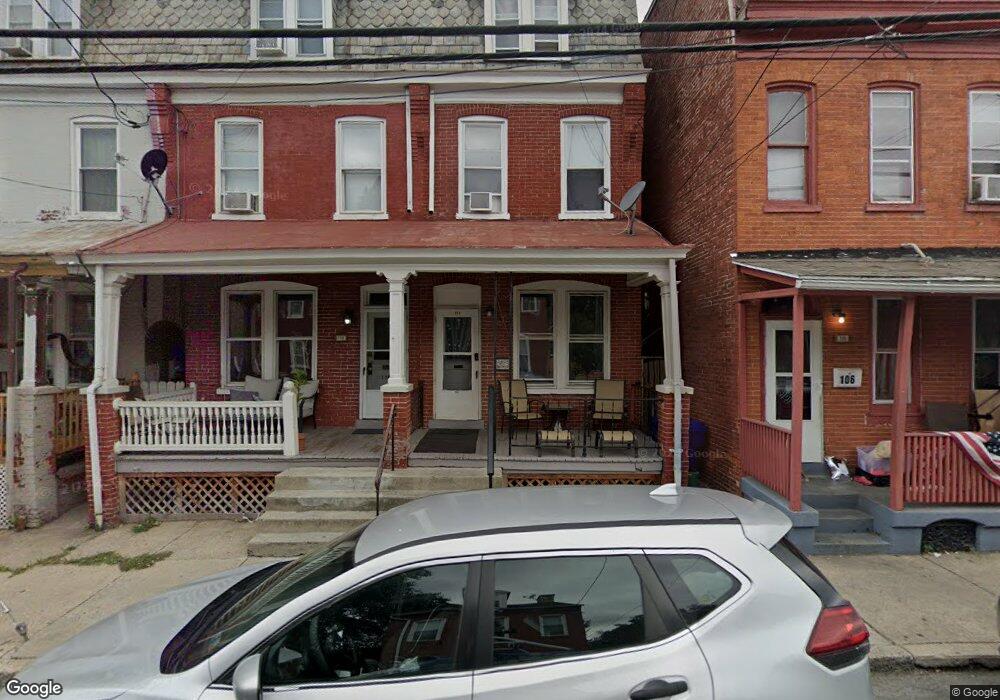
108 Coral St Lancaster, PA 17603
West End NeighborhoodEstimated Value: $181,000 - $293,000
5
Beds
2
Baths
1,710
Sq Ft
$128/Sq Ft
Est. Value
About This Home
This home is located at 108 Coral St, Lancaster, PA 17603 and is currently estimated at $219,473, approximately $128 per square foot. 108 Coral St is a home located in Lancaster County with nearby schools including Lafayette Elementary School, Wheatland Middle School, and McCaskey High School.
Ownership History
Date
Name
Owned For
Owner Type
Purchase Details
Closed on
Apr 18, 2023
Sold by
Railing W Dale
Bought by
Upside Avenue Llc
Current Estimated Value
Home Financials for this Owner
Home Financials are based on the most recent Mortgage that was taken out on this home.
Original Mortgage
$135,000
Outstanding Balance
$131,336
Interest Rate
6.73%
Mortgage Type
Seller Take Back
Estimated Equity
$88,137
Purchase Details
Closed on
Aug 26, 1999
Sold by
Carroll John T and Krasny Marvin
Bought by
Railing W Dale and Rutt David K
Create a Home Valuation Report for This Property
The Home Valuation Report is an in-depth analysis detailing your home's value as well as a comparison with similar homes in the area
Home Values in the Area
Average Home Value in this Area
Purchase History
| Date | Buyer | Sale Price | Title Company |
|---|---|---|---|
| Upside Avenue Llc | $150,000 | None Listed On Document | |
| Railing W Dale | -- | -- |
Source: Public Records
Mortgage History
| Date | Status | Borrower | Loan Amount |
|---|---|---|---|
| Open | Upside Avenue Llc | $135,000 |
Source: Public Records
Tax History Compared to Growth
Tax History
| Year | Tax Paid | Tax Assessment Tax Assessment Total Assessment is a certain percentage of the fair market value that is determined by local assessors to be the total taxable value of land and additions on the property. | Land | Improvement |
|---|---|---|---|---|
| 2025 | $2,794 | $70,600 | $12,500 | $58,100 |
| 2024 | $2,794 | $70,600 | $12,500 | $58,100 |
| 2023 | $2,747 | $70,600 | $12,500 | $58,100 |
| 2022 | $2,632 | $70,600 | $12,500 | $58,100 |
| 2021 | $2,576 | $70,600 | $12,500 | $58,100 |
| 2020 | $2,576 | $70,600 | $12,500 | $58,100 |
| 2019 | $2,537 | $70,600 | $12,500 | $58,100 |
| 2018 | $1,506 | $70,600 | $12,500 | $58,100 |
| 2017 | $2,834 | $61,700 | $14,200 | $47,500 |
| 2016 | $2,808 | $61,700 | $14,200 | $47,500 |
| 2015 | $1,095 | $61,700 | $14,200 | $47,500 |
| 2014 | $2,451 | $61,700 | $14,200 | $47,500 |
Source: Public Records
Map
Nearby Homes