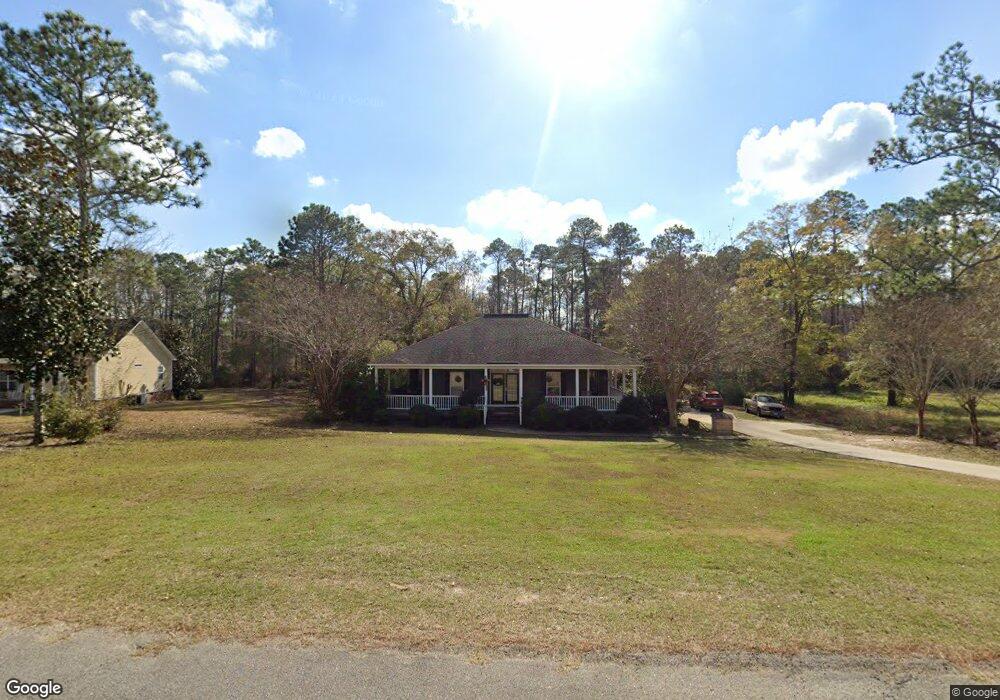
108 Creekside Dr Sylvester, GA 31791
Estimated Value: $270,081 - $362,000
3
Beds
2
Baths
2,596
Sq Ft
$125/Sq Ft
Est. Value
About This Home
This home is located at 108 Creekside Dr, Sylvester, GA 31791 and is currently estimated at $324,020, approximately $124 per square foot. 108 Creekside Dr is a home located in Worth County with nearby schools including Worth County Primary School, Worth County Elementary School, and Worth County Middle School.
Ownership History
Date
Name
Owned For
Owner Type
Purchase Details
Closed on
Oct 14, 2016
Bought by
Jennings James T
Current Estimated Value
Home Financials for this Owner
Home Financials are based on the most recent Mortgage that was taken out on this home.
Original Mortgage
$129,200
Outstanding Balance
$103,709
Interest Rate
3.5%
Mortgage Type
New Conventional
Estimated Equity
$220,311
Purchase Details
Closed on
Aug 2, 2016
Sold by
Patti M
Bought by
Bank Of America
Purchase Details
Closed on
Feb 3, 2011
Sold by
Barwick Patti M
Bought by
Barwick Patti M
Purchase Details
Closed on
Jun 19, 2008
Sold by
White David Jarrett
Bought by
William Pitti M
Home Financials for this Owner
Home Financials are based on the most recent Mortgage that was taken out on this home.
Original Mortgage
$216,601
Interest Rate
5.96%
Mortgage Type
FHA
Create a Home Valuation Report for This Property
The Home Valuation Report is an in-depth analysis detailing your home's value as well as a comparison with similar homes in the area
Home Values in the Area
Average Home Value in this Area
Purchase History
| Date | Buyer | Sale Price | Title Company |
|---|---|---|---|
| Jennings James T | $161,500 | -- | |
| Bank Of America | $161,500 | -- | |
| Barwick Patti M | -- | -- | |
| William Pitti M | $220,000 | -- |
Source: Public Records
Mortgage History
| Date | Status | Borrower | Loan Amount |
|---|---|---|---|
| Open | Jennings James T | $129,200 | |
| Previous Owner | William Pitti M | $216,601 |
Source: Public Records
Tax History Compared to Growth
Tax History
| Year | Tax Paid | Tax Assessment Tax Assessment Total Assessment is a certain percentage of the fair market value that is determined by local assessors to be the total taxable value of land and additions on the property. | Land | Improvement |
|---|---|---|---|---|
| 2024 | $2,375 | $65,794 | $8,400 | $57,394 |
| 2023 | $2,375 | $65,794 | $8,400 | $57,394 |
| 2022 | $2,260 | $64,391 | $8,400 | $55,991 |
| 2021 | $2,256 | $64,391 | $8,400 | $55,991 |
| 2020 | $2,259 | $64,391 | $8,400 | $55,991 |
| 2019 | $2,256 | $64,391 | $8,400 | $55,991 |
| 2018 | $2,183 | $64,391 | $8,400 | $55,991 |
| 2017 | $2,183 | $64,391 | $8,400 | $55,991 |
| 2016 | $2,312 | $64,391 | $8,400 | $55,991 |
| 2015 | $2,510 | $64,391 | $8,400 | $55,991 |
| 2014 | $2,510 | $75,590 | $8,400 | $67,190 |
| 2013 | -- | $75,590 | $8,400 | $67,190 |
| 2012 | -- | $75,589 | $8,400 | $67,189 |
Source: Public Records
Map
Nearby Homes
- 112 Creekwood Cir
- 100 Carriage Ln
- 0 N Isabella St Unit 161570
- 701 N Isabella St
- 1102 N Washington St
- 1007 N Isabella St
- 117 Donna Dr
- 1011 N Washington St
- 104 Lynn Cir
- 801 N Washington St
- 101 Elm St
- 203 E Pinson St
- 109 Huntington Ct
- 402 N McPhaul St
- 0 Ga Hwy 82 Unit 913408
- 1432 S Ga Hwy 33s
- 316 Bell Rd
- 0 W Pinson St Unit 10582366
- 103 Dunbar Cir
- 107 Dunbar Cir
- 110 Creekside Dr
- 106 Creekside Dr
- 105 Creekside Dr
- 104 Creekside Dr
- 112 Creekside Dr
- 114 Creekside Dr
- 107 Creekside Dr
- 116 Creekside Dr
- 101 Creekwood Cir
- 102 Creekwood Cir
- 105 Creekwood Cir
- 106 Creekwood Cir
- 109 Creekside Dr
- 103 Creekwood Cir
- 118 Creekside Dr
- 108 Creekwood Cir
- 111 Creekside Dr
- 120 Creekside Dr
- 122 Creekside Dr
- 107 Creekwood Cir