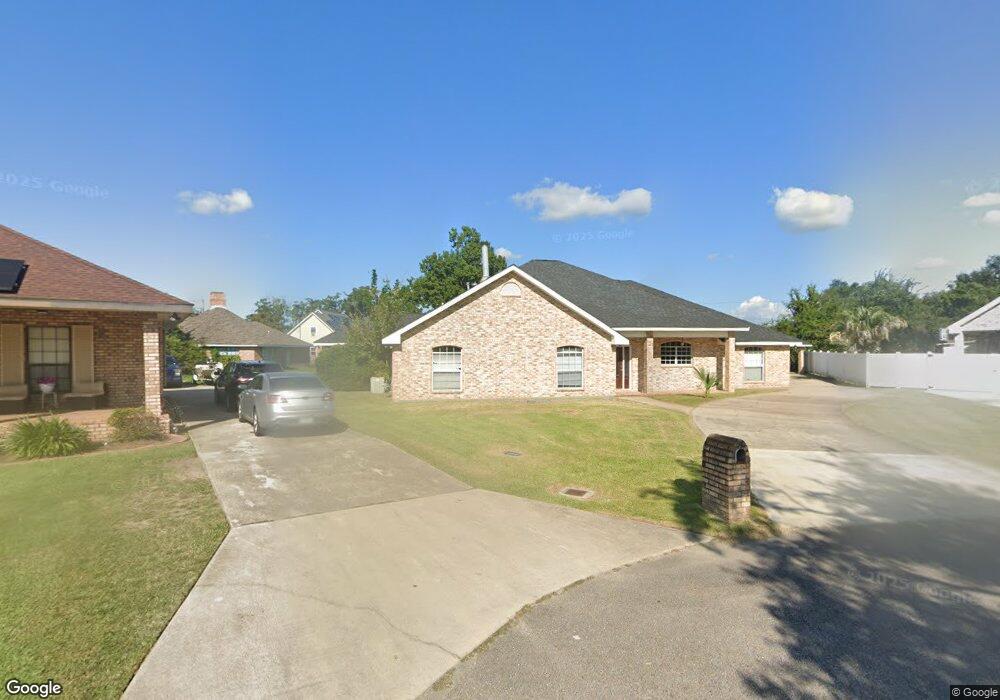
108 Debra Ct Luling, LA 70070
Estimated Value: $327,000 - $407,737
4
Beds
3
Baths
3,111
Sq Ft
$117/Sq Ft
Est. Value
About This Home
This home is located at 108 Debra Ct, Luling, LA 70070 and is currently estimated at $363,184, approximately $116 per square foot. 108 Debra Ct is a home located in St. Charles Parish with nearby schools including Mimosa Park Elementary School, Lakewood Elementary School, and J.B. Martin Middle School.
Ownership History
Date
Name
Owned For
Owner Type
Purchase Details
Closed on
Feb 23, 2022
Sold by
Codd Denise K
Bought by
Cooper Mr
Current Estimated Value
Purchase Details
Closed on
Feb 2, 2022
Sold by
Codd Denise K
Bought by
Cooper Mr
Purchase Details
Closed on
Jul 17, 2009
Sold by
Simon Kendra Develle and Simon Raymond G
Bought by
Codd Denise K and Codd Edward S
Home Financials for this Owner
Home Financials are based on the most recent Mortgage that was taken out on this home.
Original Mortgage
$274,928
Interest Rate
4.93%
Mortgage Type
FHA
Create a Home Valuation Report for This Property
The Home Valuation Report is an in-depth analysis detailing your home's value as well as a comparison with similar homes in the area
Home Values in the Area
Average Home Value in this Area
Purchase History
| Date | Buyer | Sale Price | Title Company |
|---|---|---|---|
| Cooper Mr | $231,000 | -- | |
| Cooper Mr | $231,000 | -- | |
| Codd Denise K | $280,000 | American Title Agency Ltd |
Source: Public Records
Mortgage History
| Date | Status | Borrower | Loan Amount |
|---|---|---|---|
| Previous Owner | Codd Denise K | $274,928 |
Source: Public Records
Tax History
| Year | Tax Paid | Tax Assessment Tax Assessment Total Assessment is a certain percentage of the fair market value that is determined by local assessors to be the total taxable value of land and additions on the property. | Land | Improvement |
|---|---|---|---|---|
| 2025 | $3,765 | $37,250 | $8,100 | $29,150 |
| 2024 | $3,765 | $37,250 | $8,100 | $29,150 |
| 2023 | $3,823 | $28,510 | $5,880 | $22,630 |
| 2022 | $3,334 | $28,510 | $5,880 | $22,630 |
| 2021 | $2,546 | $21,586 | $5,292 | $16,294 |
| 2020 | $3,368 | $28,510 | $5,880 | $22,630 |
| 2019 | $3,114 | $26,265 | $4,300 | $21,965 |
| 2018 | $3,091 | $26,265 | $4,300 | $21,965 |
| 2017 | $3,087 | $26,265 | $4,300 | $21,965 |
| 2016 | $3,100 | $26,265 | $4,300 | $21,965 |
| 2015 | $1,923 | $23,851 | $2,915 | $20,936 |
| 2014 | $1,852 | $23,851 | $2,915 | $20,936 |
| 2013 | $1,859 | $23,851 | $2,915 | $20,936 |
Source: Public Records
Map
Nearby Homes
Your Personal Tour Guide
Ask me questions while you tour the home.