Estimated Value: $137,044 - $189,000
--
Bed
1
Bath
1,381
Sq Ft
$117/Sq Ft
Est. Value
About This Home
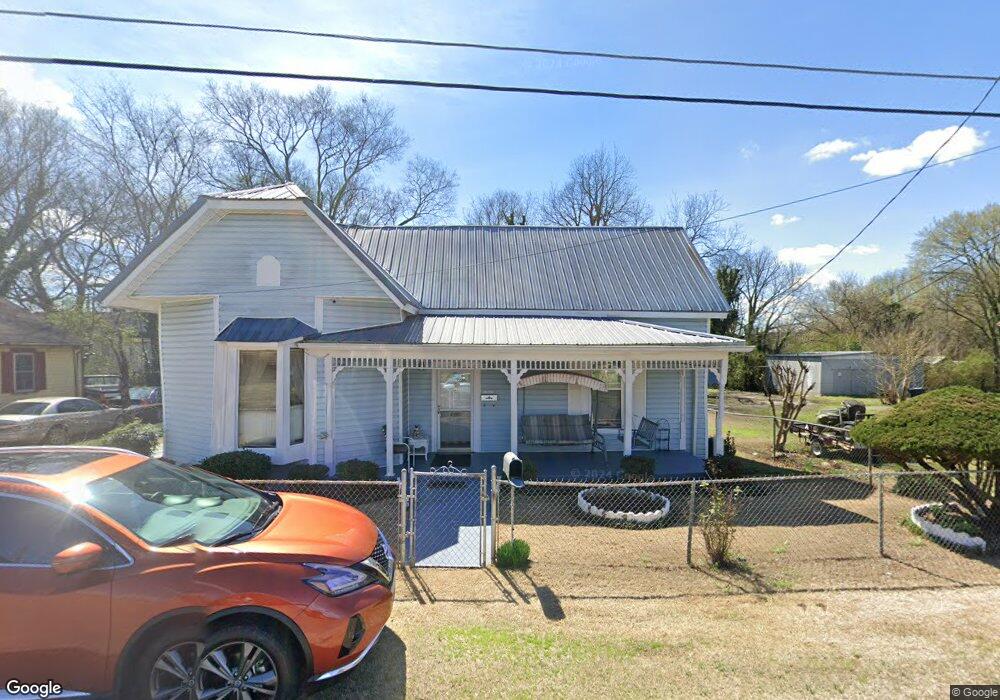
This home is located at 108 E 14th St SW, Rome, GA 30161 and is currently estimated at $162,011, approximately $117 per square foot. 108 E 14th St SW is a home located in Floyd County with nearby schools including Rome High School, Darlington School, and St. Mary School.
Ownership History
Date
Name
Owned For
Owner Type
Purchase Details
Closed on
Jul 31, 1997
Bought by
P and R
Current Estimated Value
Purchase Details
Closed on
Jun 4, 1996
Sold by
North Charles L and North Debra D
Bought by
Hall Walter J and Hall Brenda T
Purchase Details
Closed on
Mar 29, 1993
Sold by
North Debra D
Bought by
North Charles L and North Debra D
Purchase Details
Closed on
Apr 1, 1989
Sold by
Dobbins Dobbins M and Dobbins Gary
Bought by
North Debra D
Purchase Details
Closed on
Jan 1, 1989
Sold by
Dillard Mary Francis
Bought by
Dobbins Dobbins M and Dobbins Gary
Purchase Details
Closed on
Feb 14, 1977
Sold by
Dilliard Tony
Bought by
Dillard Mary Francis
Purchase Details
Closed on
Dec 16, 1972
Sold by
Morgan Jackson D
Bought by
Dilliard Tony
Purchase Details
Closed on
Jun 29, 1972
Sold by
Pulliam Mrs Marvin R Viola Roberson Pu
Bought by
Morgan Jackson D
Purchase Details
Closed on
Sep 28, 1971
Sold by
Pullian M R
Bought by
Pulliam Mrs Marvin R Viola Roberson
Purchase Details
Closed on
Jan 1, 1901
Bought by
Pullian M R
Create a Home Valuation Report for This Property
The Home Valuation Report is an in-depth analysis detailing your home's value as well as a comparison with similar homes in the area
Home Values in the Area
Average Home Value in this Area
Purchase History
| Date | Buyer | Sale Price | Title Company |
|---|---|---|---|
| P | -- | -- | |
| Hall Walter J | -- | -- | |
| North Charles L | -- | -- | |
| North Debra D | -- | -- | |
| Dobbins Dobbins M | -- | -- | |
| Dillard Mary Francis | -- | -- | |
| Dilliard Tony | $14,000 | -- | |
| Morgan Jackson D | $5,000 | -- | |
| Pulliam Mrs Marvin R Viola Roberson | -- | -- | |
| Pullian M R | -- | -- |
Source: Public Records
Tax History Compared to Growth
Tax History
| Year | Tax Paid | Tax Assessment Tax Assessment Total Assessment is a certain percentage of the fair market value that is determined by local assessors to be the total taxable value of land and additions on the property. | Land | Improvement |
|---|---|---|---|---|
| 2024 | $1,180 | $48,026 | $4,879 | $43,147 |
| 2023 | $1,049 | $40,750 | $4,435 | $36,315 |
| 2022 | $956 | $33,366 | $3,548 | $29,818 |
| 2021 | $908 | $29,984 | $3,548 | $26,436 |
| 2020 | $872 | $27,603 | $2,772 | $24,831 |
| 2019 | $837 | $25,973 | $2,772 | $23,201 |
| 2018 | $809 | $24,367 | $2,772 | $21,595 |
| 2017 | $792 | $23,379 | $2,772 | $20,607 |
| 2016 | $784 | $22,803 | $2,760 | $20,043 |
| 2015 | $742 | $22,803 | $2,760 | $20,043 |
| 2014 | $742 | $22,803 | $2,760 | $20,043 |
Source: Public Records
Map
Nearby Homes
- 106 E 14th St SW
- 24 E 16th St SW
- 39 E 16th St SW
- 306 Strand St SW
- 109 Crescent Ave SW
- 335 S McLin St SW
- 316 S McLin St SW
- 000 E Oglethorpe Hwy
- 1502 Spring Creek St SW
- 424 Cedar Ave SW
- 4 E 15th St SW
- 164 E 11th St SE
- 168 E 11th St SE
- 178 E 11th St SW
- 166 E 11th St SW
- 170 E 11th St SW
- 2 E 10th St SW
- 162 E 11th St SE
- 200 Cave Spring St SW
- 106 14th St E
- 110 E 14th St SW
- 8 E 15th St SW
- 104 E 14th St SW
- 4 15th St SW
- 1410 Hull Ave SW
- 9 E 15th St SW
- 9 E 15th St SW Unit B
- E 15th St
- 11 E 15th St SW
- 307 Cedar Ave SW
- 200 E 14th St SW
- 1403 Crane St SW
- 1405 Crane St SW
- 1409 Crane St SW
- 202 E 14th St SW
- 202 E 14th St SW
- 1503 Crane St SW
- 1321 Crane St SW
- 101 E 15th St SW