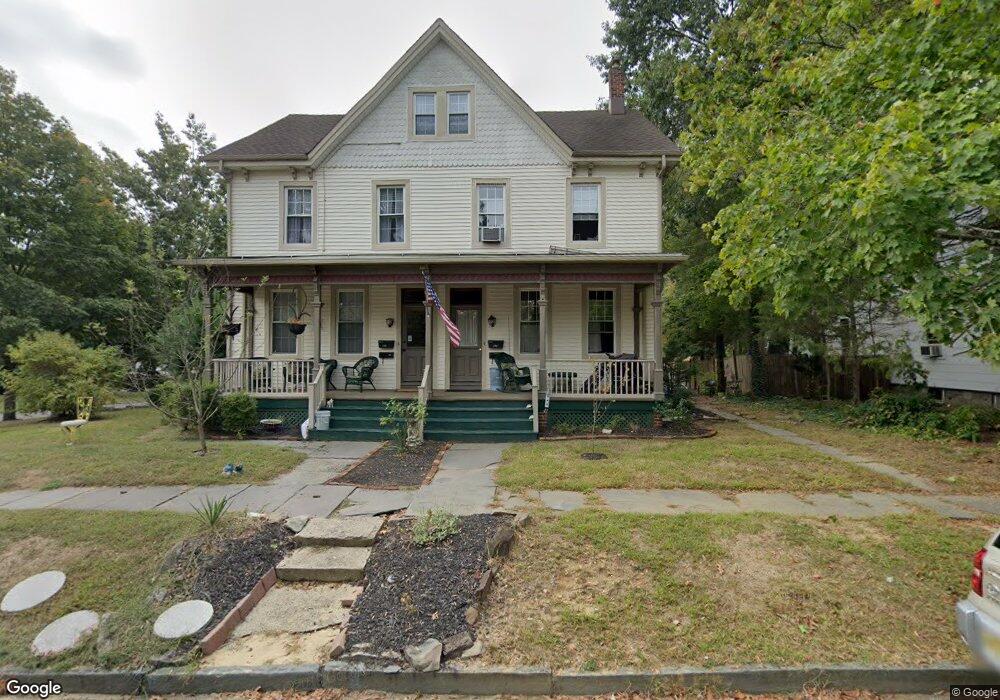
108 E Elm St Unit 110 Wenonah, NJ 08090
Estimated Value: $673,299 - $835,000
--
Bed
--
Bath
4,307
Sq Ft
$174/Sq Ft
Est. Value
About This Home
This home is located at 108 E Elm St Unit 110, Wenonah, NJ 08090 and is currently estimated at $748,325, approximately $173 per square foot. 108 E Elm St Unit 110 is a home located in Gloucester County with nearby schools including Wenonah Elementary School, Gateway Regional High School, and St Margaret Regional School.
Ownership History
Date
Name
Owned For
Owner Type
Purchase Details
Closed on
Jun 6, 2019
Sold by
Abode Properties Llc
Bought by
Burress Stephen E and Burress Michelle L
Current Estimated Value
Home Financials for this Owner
Home Financials are based on the most recent Mortgage that was taken out on this home.
Original Mortgage
$328,500
Outstanding Balance
$288,832
Interest Rate
4.1%
Mortgage Type
New Conventional
Estimated Equity
$459,493
Purchase Details
Closed on
Feb 12, 2016
Sold by
Andrews Robert W
Bought by
Adobe Properties Llc
Purchase Details
Closed on
Jun 12, 2006
Sold by
Kam Properties
Bought by
Robert Andrews
Purchase Details
Closed on
Dec 3, 2001
Sold by
Keyko Paul A
Bought by
Kam Properties Inc
Create a Home Valuation Report for This Property
The Home Valuation Report is an in-depth analysis detailing your home's value as well as a comparison with similar homes in the area
Home Values in the Area
Average Home Value in this Area
Purchase History
| Date | Buyer | Sale Price | Title Company |
|---|---|---|---|
| Burress Stephen E | $438,000 | Coretitle | |
| Adobe Properties Llc | -- | -- | |
| Robert Andrews | -- | -- | |
| Kam Properties Inc | $235,000 | -- |
Source: Public Records
Mortgage History
| Date | Status | Borrower | Loan Amount |
|---|---|---|---|
| Open | Burress Stephen E | $328,500 |
Source: Public Records
Tax History Compared to Growth
Tax History
| Year | Tax Paid | Tax Assessment Tax Assessment Total Assessment is a certain percentage of the fair market value that is determined by local assessors to be the total taxable value of land and additions on the property. | Land | Improvement |
|---|---|---|---|---|
| 2025 | $17,988 | $405,600 | $88,400 | $317,200 |
| 2024 | $17,112 | $405,600 | $88,400 | $317,200 |
| 2023 | $17,112 | $405,600 | $88,400 | $317,200 |
| 2022 | $16,991 | $405,600 | $88,400 | $317,200 |
| 2021 | $17,153 | $405,600 | $88,400 | $317,200 |
| 2020 | $17,088 | $405,600 | $88,400 | $317,200 |
| 2019 | $16,812 | $405,600 | $88,400 | $317,200 |
| 2018 | $16,524 | $405,600 | $88,400 | $317,200 |
| 2017 | $16,524 | $405,600 | $88,400 | $317,200 |
| 2016 | $16,171 | $405,600 | $88,400 | $317,200 |
| 2015 | $15,827 | $405,600 | $88,400 | $317,200 |
| 2014 | $15,578 | $465,000 | $105,000 | $360,000 |
Source: Public Records
Map
Nearby Homes
- 3 E Mantua Ave
- 1 W Buttonwood St
- 8 W Buttonwood St
- 108 S Clinton Ave
- 0 Glassboro Rd
- 513 N East Ave
- 100 Fernshire Ct
- 261 Wenonah Way
- 707 Howard Ave
- 100 Fairmount St
- 315 Ogden Station Rd
- 221 Woodcreek Rd
- 134 Carver Dr
- 118 Bock Ave
- 579 Lehigh Rd
- 183 Lincoln Rd
- 916 Georgetown Rd
- 1008 Jericho Ln
- 114 Buddy Powell Ln
- 975 Lindsey Dr
- 110 B E Elm St Unit 110 B
- 108 E Elm St Unit B
- 108-110 E Elm St
- 110 E Elm St Unit B
- 108-110 110 E Elm St
- 106 E Elm St
- 104 E Elm St
- 106 N Marion Ave
- 202 E Elm St
- 200 N Marion Ave
- 104 N Marion Ave
- 201 E Elm St
- 107 N Clinton Ave
- 109 N Clinton Ave
- 107 N Marion Ave
- 102 N Marion Ave
- 105 N Clinton Ave
- 202 N Marion Ave
- 206 E Elm St
- 101 E Elm St