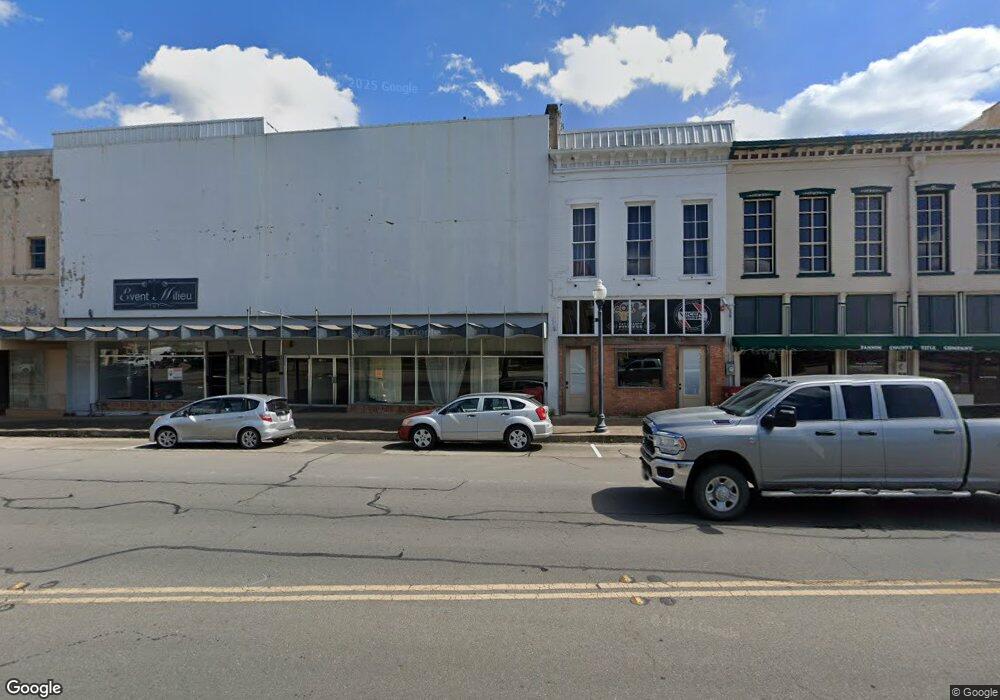
108 E Sam Rayburn Dr Bonham, TX 75418
Studio
--
Bath
2,800
Sq Ft
1,307
Sq Ft
About This Home
This home is located at 108 E Sam Rayburn Dr, Bonham, TX 75418. 108 E Sam Rayburn Dr is a home located in Fannin County with nearby schools including Evans Elementary School, Finley-Oates Elementary School, and LH Rather Jr High School.
Ownership History
Date
Name
Owned For
Owner Type
Purchase Details
Closed on
Sep 30, 2021
Sold by
Old School Enterprises Two Llc
Bought by
Lawdawg Properties Llc
Purchase Details
Closed on
Dec 21, 2018
Sold by
Old School Enterprises Three Llc
Bought by
Old School Enterprises Two Llc
Purchase Details
Closed on
Aug 3, 2018
Sold by
Foro Resources Llc
Bought by
Old School Enterprises Three Llc
Purchase Details
Closed on
Feb 12, 2016
Sold by
Texcel Exploration Inc
Bought by
108 E Sam Rayburn and Foro Resources Llc
Purchase Details
Closed on
Dec 10, 2008
Sold by
Skalecky Frank and Skalecky Ann
Bought by
Texcel Exploration Inc
Home Financials for this Owner
Home Financials are based on the most recent Mortgage that was taken out on this home.
Original Mortgage
$59,800
Interest Rate
6.19%
Mortgage Type
Construction
Create a Home Valuation Report for This Property
The Home Valuation Report is an in-depth analysis detailing your home's value as well as a comparison with similar homes in the area
Purchase History
| Date | Buyer | Sale Price | Title Company |
|---|---|---|---|
| Lawdawg Properties Llc | -- | Main Street Title | |
| Old School Enterprises Two Llc | -- | Main Street Title | |
| Old School Enterprises Three Llc | -- | Main Street Title | |
| 108 E Sam Rayburn | -- | None Available | |
| Texcel Exploration Inc | -- | None Available |
Source: Public Records
Mortgage History
| Date | Status | Borrower | Loan Amount |
|---|---|---|---|
| Previous Owner | Texcel Exploration Inc | $59,800 |
Source: Public Records
Tax History
| Year | Tax Paid | Tax Assessment Tax Assessment Total Assessment is a certain percentage of the fair market value that is determined by local assessors to be the total taxable value of land and additions on the property. | Land | Improvement |
|---|---|---|---|---|
| 2025 | $5,558 | $286,550 | $26,370 | $260,180 |
| 2024 | $4,972 | $256,320 | $13,160 | $243,160 |
| 2023 | $4,497 | $228,050 | $10,380 | $217,670 |
| 2022 | $4,739 | $215,480 | $10,380 | $205,100 |
| 2021 | $2,563 | $101,400 | $6,730 | $94,670 |
| 2020 | $2,243 | $87,750 | $6,260 | $81,490 |
| 2019 | $2,350 | $88,430 | $6,260 | $82,170 |
| 2018 | $1,921 | $72,370 | $6,260 | $66,110 |
| 2017 | $1,444 | $56,480 | $6,270 | $50,210 |
| 2016 | $1,444 | $56,480 | $6,020 | $50,460 |
| 2015 | -- | $50,410 | $5,960 | $44,450 |
| 2014 | -- | $54,980 | $6,270 | $48,710 |
Source: Public Records
Map
Nearby Homes
- LOT 2 TBD County Road 2005
- TBD W Fm 274
- TBD LOT 1 County Road 2005
- tbd lot 3 County Road 2005
- 505 W 3rd St
- 314 E 2nd St
- 401 W Sam Rayburn Dr Unit 1
- 611 Chestnut St
- 410 E 6th St
- 420 E 5th St
- 300 W 6th St
- 520 E 5th St
- 320 W 6th St
- 102 Elm St
- 419 W 5th St
- 514 E 5th St
- 202 Pine St
- 814 Chestnut St
- 602 W 3rd St
- 306 E 2nd St
- 314 N Main St
- #### Texas 56
- TBD3 Texas 56
- TBD2 Texas 56
- TBD Texas 56
- 2273 Texas 56
- 105 E 3rd St
- 302 N Main St
- 111 Hwy 82
- 1 E 1st & Pine St
- Lot 13 Largo - Lot 13 St
- tbd County Rd 1110
- TBD County Rd 2605
- Lot 36 W Hemby Way
- TBD Cr 4245b
- Lot 37 Hemby Way
- Lot 36 Hemby Way
- Lot 35 Hemby Way
- Lot 34 Hemby Way
- Lot 16 Largo St
Your Personal Tour Guide
Ask me questions while you tour the home.