
Seller's Agent in 2024
Britney Diane Powell
Envision Real Estate Team - Rochester
(574) 242-2887
57 Total Sales


Estimated Value: $195,000 - $250,000
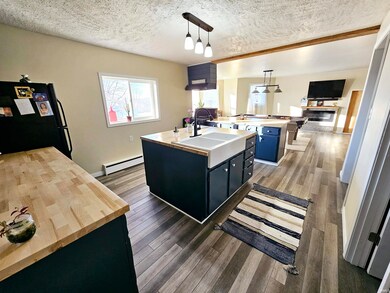
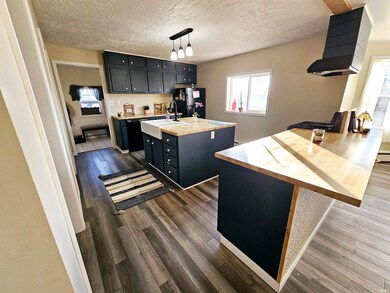
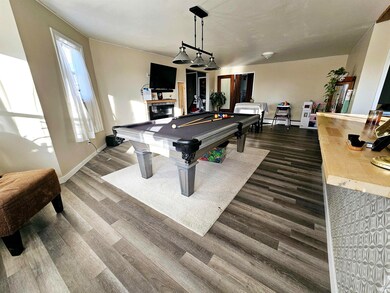
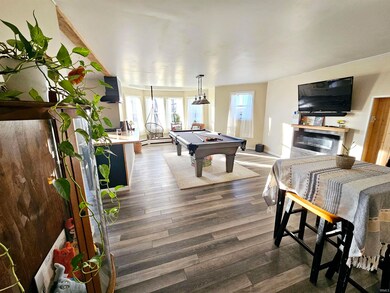
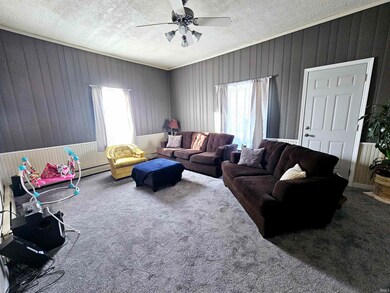
Beautifully updated spacious home in the quaint town of Claypool! This home offers 3-4 bedrooms, 3.5 bathrooms, open concept kitchen/dining/living room, family room, and large unfinished basement with endless possibilities. The kitchen features new butcher block counter tops, nearly new dishwasher, an apron sink, and a walk-in pantry! Main floor master suite boasts a custom walk-in shower and jetted tub. Over 2000 square ft of living space situated on a large corner lot!
Last Agent to Sell the Property
Envision Real Estate Team - Rochester Brokerage Phone: 574-242-2887 Listed on: 11/29/2023
| Date | Buyer | Sale Price | Title Company |
|---|---|---|---|
| Kazmierczak Michael | $190,000 | Fidelity National Title | |
| Jeffers Bradley A | -- | Attorney | |
| Bays Joshua L | -- | None Available | |
| Smith Dora E | -- | None Available | |
| Sabo Derek J | $38,000 | Title One & Real Estate Exch | |
| Sabo Derek J | -- | None Available | |
| Federal National Mortgage Association | -- | Mercer Belanger | |
| Federal National Mortgage Association | -- | None Available | |
| Chase Home Finance Llc | $77,220 | Mercer Belanger | |
| Chase Home Finance Llc | $77,220 | None Available | |
| Thomas Phillip A | $60,000 | -- |
| Date | Status | Borrower | Loan Amount |
|---|---|---|---|
| Open | Kazmierczak Michael | $152,000 | |
| Previous Owner | Jeffers Bradley A | $44,910 |
| Date | Event | Price | List to Sale | Price per Sq Ft | Prior Sale |
|---|---|---|---|---|---|
| 02/22/2024 02/22/24 | Sold | $190,000 | -2.5% | $92 / Sq Ft | |
| 11/29/2023 11/29/23 | For Sale | $194,900 | +290.6% | $94 / Sq Ft | |
| 02/22/2016 02/22/16 | Sold | $49,900 | -16.8% | $16 / Sq Ft | View Prior Sale |
| 01/21/2016 01/21/16 | Pending | -- | -- | -- | |
| 05/29/2015 05/29/15 | For Sale | $60,000 | -- | $19 / Sq Ft |
| Year | Tax Paid | Tax Assessment Tax Assessment Total Assessment is a certain percentage of the fair market value that is determined by local assessors to be the total taxable value of land and additions on the property. | Land | Improvement |
|---|---|---|---|---|
| 2025 | $1,603 | $190,600 | $42,700 | $147,900 |
| 2024 | $1,603 | $171,700 | $24,500 | $147,200 |
| 2023 | $656 | $99,300 | $14,400 | $84,900 |
| 2022 | $545 | $88,300 | $13,300 | $75,000 |
| 2021 | $446 | $81,300 | $13,300 | $68,000 |
| 2020 | $474 | $83,100 | $13,300 | $69,800 |
| 2019 | $479 | $83,100 | $13,300 | $69,800 |
| 2018 | $475 | $81,300 | $13,300 | $68,000 |
| 2017 | $428 | $79,700 | $13,300 | $66,400 |
| 2016 | $438 | $78,900 | $10,300 | $68,600 |
| 2014 | $514 | $82,100 | $11,100 | $71,000 |
| 2013 | $514 | $86,500 | $11,200 | $75,300 |
Seller's Agent in 2024
Britney Diane Powell
Envision Real Estate Team - Rochester
(574) 242-2887
57 Total Sales
Buyer's Agent in 2024
Julie Hall
Patton Hall Real Estate
(574) 268-7645
924 Total Sales
K
Seller's Agent in 2016
Karen Craft
Coldwell Banker Real Estate Group
Source: Indiana Regional MLS
MLS Number: 202343194
APN: 43-15-20-100-018.000-002
Disclaimer: Certain information contained herein is derived from information provided by parties other than Homes.com. All information provided is deemed reliable, but is not guaranteed to be accurate and should be independently verified.
![]() Based on information submitted to the MLS GRID. All data is obtained from various sources and may not have been verified by broker or MLS GRID. Supplied Open House Information is subject to change without notice. All information should be independently reviewed and verified for accuracy. Properties may or may not be listed by the office/agent presenting the information. Some IDX listings have been excluded from this website. IDX information is provided exclusively for personal, non-commercial use, and may not be used for any purpose other than to identify prospective properties consumers may be interested in purchasing. Information is deemed reliable but not guaranteed.
Based on information submitted to the MLS GRID. All data is obtained from various sources and may not have been verified by broker or MLS GRID. Supplied Open House Information is subject to change without notice. All information should be independently reviewed and verified for accuracy. Properties may or may not be listed by the office/agent presenting the information. Some IDX listings have been excluded from this website. IDX information is provided exclusively for personal, non-commercial use, and may not be used for any purpose other than to identify prospective properties consumers may be interested in purchasing. Information is deemed reliable but not guaranteed.
Based on information submitted to the MLS GRID
Ask me questions while you tour the home.