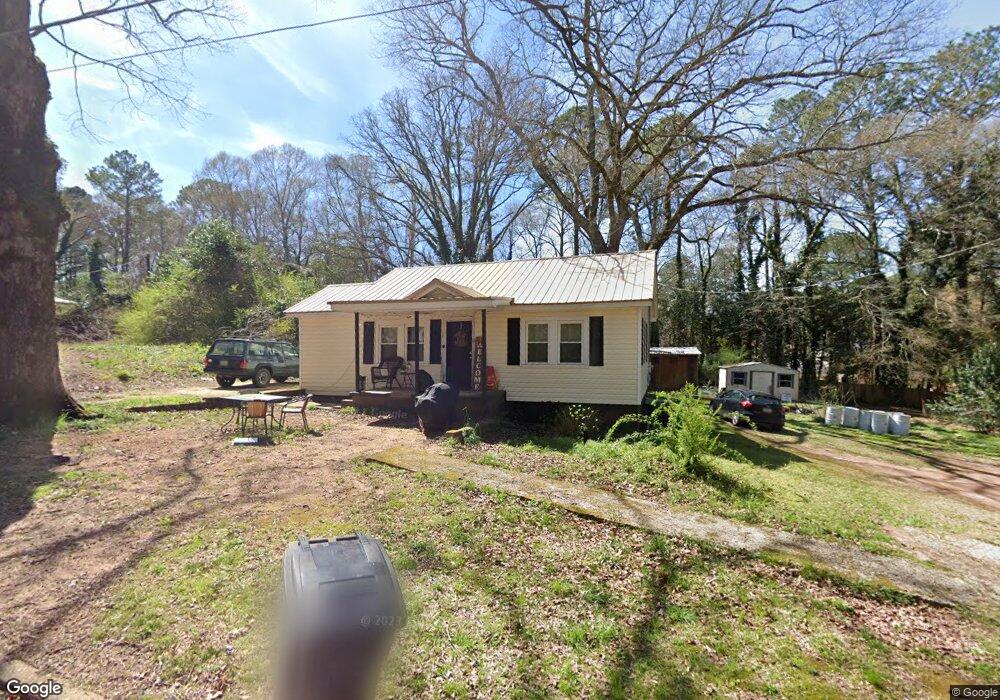
108 Ewing St Lagrange, GA 30240
Estimated Value: $109,000 - $167,000
3
Beds
1
Bath
968
Sq Ft
$144/Sq Ft
Est. Value
About This Home
This home is located at 108 Ewing St, Lagrange, GA 30240 and is currently estimated at $139,175, approximately $143 per square foot. 108 Ewing St is a home located in Troup County with nearby schools including Franklin Forest Elementary School, Hollis Hand Elementary School, and Ethel W. Kight Elementary School.
Ownership History
Date
Name
Owned For
Owner Type
Purchase Details
Closed on
Jan 20, 2015
Sold by
Lynch Cody
Bought by
Terry Christopher Jackson
Current Estimated Value
Purchase Details
Closed on
Sep 12, 2011
Sold by
Smith Luther J
Bought by
Linch Michael Dewayne
Purchase Details
Closed on
Feb 27, 2006
Sold by
Smith Bartha
Bought by
Smith Luther J and Smith Bartha
Purchase Details
Closed on
Sep 21, 1999
Sold by
Shrider Lynda
Bought by
Bartha Smith
Purchase Details
Closed on
Oct 29, 1998
Sold by
Hanner O W
Bought by
Shrider Lynda
Purchase Details
Closed on
Oct 27, 1989
Sold by
Hanner
Bought by
Hanner O W
Purchase Details
Closed on
Jan 1, 1972
Sold by
Spradlin
Bought by
Hanner
Purchase Details
Closed on
Jan 1, 1963
Sold by
Otha C Doster
Bought by
Spradlin
Create a Home Valuation Report for This Property
The Home Valuation Report is an in-depth analysis detailing your home's value as well as a comparison with similar homes in the area
Purchase History
| Date | Buyer | Sale Price | Title Company |
|---|---|---|---|
| Terry Christopher Jackson | -- | -- | |
| Lynch Cody | -- | -- | |
| Linch Michael Dewayne | -- | -- | |
| Smith Luther J | -- | -- | |
| Bartha Smith | $12,000 | -- | |
| Shrider Lynda | -- | -- | |
| Hanner O W | -- | -- | |
| Hanner | -- | -- | |
| Spradlin | -- | -- |
Source: Public Records
Tax History
| Year | Tax Paid | Tax Assessment Tax Assessment Total Assessment is a certain percentage of the fair market value that is determined by local assessors to be the total taxable value of land and additions on the property. | Land | Improvement |
|---|---|---|---|---|
| 2025 | $876 | $32,124 | $3,280 | $28,844 |
| 2024 | $777 | $28,500 | $3,280 | $25,220 |
| 2023 | $578 | $21,188 | $3,280 | $17,908 |
| 2022 | $563 | $20,188 | $3,280 | $16,908 |
| 2021 | $396 | $13,136 | $3,280 | $9,856 |
| 2020 | $396 | $13,136 | $3,280 | $9,856 |
| 2019 | $381 | $12,640 | $3,328 | $9,312 |
| 2018 | $381 | $12,640 | $3,328 | $9,312 |
| 2017 | $381 | $12,640 | $3,328 | $9,312 |
| 2016 | $381 | $12,620 | $3,328 | $9,292 |
| 2015 | $381 | $12,620 | $3,328 | $9,292 |
| 2014 | $68 | $12,131 | $3,328 | $8,803 |
| 2013 | -- | $12,651 | $3,328 | $9,323 |
Source: Public Records
Map
Nearby Homes
- 106 Ewing St
- 724 Camellia Dr
- 732 Camellia Dr
- 201 S Chilton Crescent
- 203 S Chilton Crescent
- 204 Colonial St
- 110 Russell St
- 900 North St
- 222 Beechwood Cir
- 102 Beech Creek Dr
- 204 Dixie Creek Dr
- 109 Thomas St
- 806 New Franklin Rd
- 219 Banks St
- 114 Briarcliff Rd
- 202 Park Hill Dr
- 102 Dogwood Dr
- 705 Piney Woods Dr
- 120 Saynor Cir
- 910 Piney Woods Dr
- 104 Ewing St
- 110 Ewing St
- 130 Sunset St
- 726 Camellia Dr
- 722 Camellia Dr
- 722 Camellia Dr Unit 198
- 120 Sunset St
- 100 Ewing St
- 728 Camellia Dr
- 720 Camellia Dr
- 118 Sunset St
- 123 Sunset St
- 730 Camellia Dr
- 114 Sunset St
- 121 Sunset St
- 933 Norwood Dr
- 718 Camellia Dr
- 717 Camellia Dr
- 715 Camellia Dr
- 719 Camellia Dr
Your Personal Tour Guide
Ask me questions while you tour the home.