Estimated Value: $194,000 - $216,000
3
Beds
2
Baths
1,377
Sq Ft
$152/Sq Ft
Est. Value
About This Home
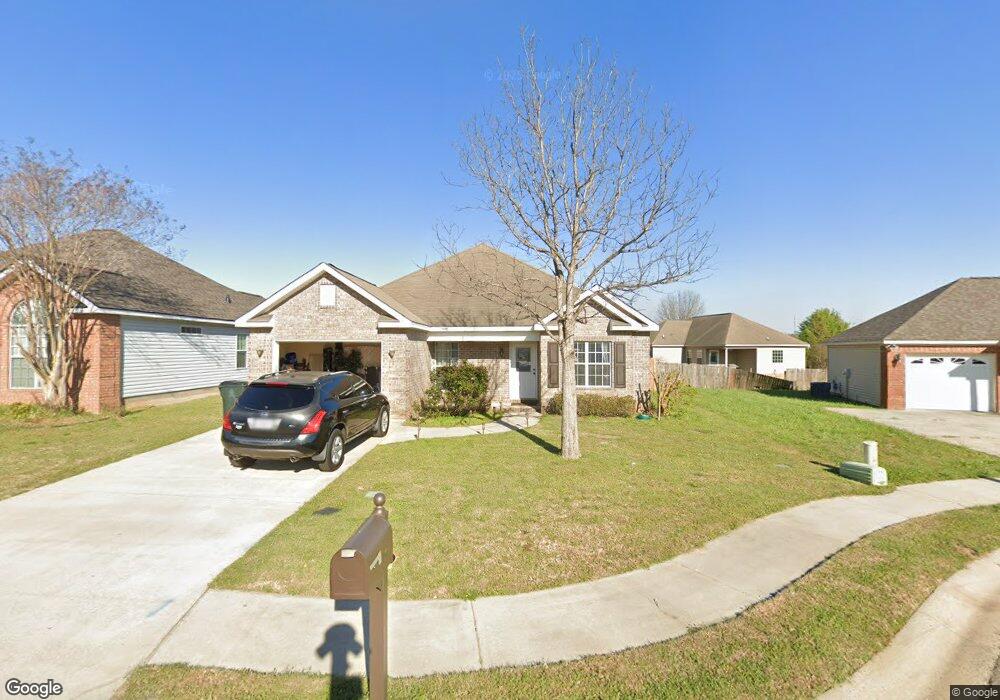
This home is located at 108 Greenspan Way, Byron, GA 31008 and is currently estimated at $209,523, approximately $152 per square foot. 108 Greenspan Way is a home located in Houston County with nearby schools including Eagle Springs Elementary School, Thomson Middle School, and Northside High School.
Ownership History
Date
Name
Owned For
Owner Type
Purchase Details
Closed on
Dec 29, 2023
Sold by
Reid Lorea A
Bought by
Robinson Alan
Current Estimated Value
Home Financials for this Owner
Home Financials are based on the most recent Mortgage that was taken out on this home.
Original Mortgage
$171,000
Outstanding Balance
$168,274
Interest Rate
7.44%
Mortgage Type
New Conventional
Estimated Equity
$41,249
Purchase Details
Closed on
Mar 25, 2008
Sold by
Federal National Mortgage Association
Bought by
Reid Lorea A
Home Financials for this Owner
Home Financials are based on the most recent Mortgage that was taken out on this home.
Original Mortgage
$100,500
Interest Rate
6.22%
Mortgage Type
Purchase Money Mortgage
Purchase Details
Closed on
Dec 7, 2005
Sold by
3-D Homes Inc
Bought by
Wilkes Shaun C
Purchase Details
Closed on
Jun 9, 2004
Sold by
Mcglamry Charlie N
Bought by
3-D Homes Inc
Create a Home Valuation Report for This Property
The Home Valuation Report is an in-depth analysis detailing your home's value as well as a comparison with similar homes in the area
Home Values in the Area
Average Home Value in this Area
Purchase History
| Date | Buyer | Sale Price | Title Company |
|---|---|---|---|
| Robinson Alan | $180,000 | None Listed On Document | |
| Reid Lorea A | -- | None Available | |
| Wilkes Shaun C | $111,100 | -- | |
| 3-D Homes Inc | $17,500 | -- |
Source: Public Records
Mortgage History
| Date | Status | Borrower | Loan Amount |
|---|---|---|---|
| Open | Robinson Alan | $171,000 | |
| Previous Owner | Reid Lorea A | $100,500 |
Source: Public Records
Tax History Compared to Growth
Tax History
| Year | Tax Paid | Tax Assessment Tax Assessment Total Assessment is a certain percentage of the fair market value that is determined by local assessors to be the total taxable value of land and additions on the property. | Land | Improvement |
|---|---|---|---|---|
| 2024 | $2,356 | $74,400 | $12,000 | $62,400 |
| 2023 | $2,009 | $60,920 | $10,000 | $50,920 |
| 2022 | $1,156 | $50,280 | $8,000 | $42,280 |
| 2021 | $944 | $40,840 | $6,600 | $34,240 |
| 2020 | $932 | $40,120 | $6,600 | $33,520 |
| 2019 | $932 | $40,120 | $6,600 | $33,520 |
| 2018 | $932 | $40,120 | $6,600 | $33,520 |
| 2017 | $933 | $40,120 | $6,600 | $33,520 |
| 2016 | $934 | $40,120 | $6,600 | $33,520 |
| 2015 | -- | $40,120 | $6,600 | $33,520 |
| 2014 | $401 | $40,120 | $6,600 | $33,520 |
| 2013 | $401 | $40,120 | $6,600 | $33,520 |
Source: Public Records
Map
Nearby Homes
- 106 Greenspan Way
- 110 Greenspan Way
- 509 Covington Cove
- 104 Greenspan Way
- 507 Covington Cove
- 511 Covington Cove
- 505 Covington Cove
- 112 Greenspan Way
- 117 Greenspan Way
- 102 Greenspan Way
- 119 Greenspan Way
- 503 Covington Cove
- 115 Greenspan Way
- 113 Greenspan Way
- 513 Covington Cove
- 121 Greenspan Way
- 100 Greenspan Way
- 501 Covington Cove
- 123 Greenspan Way
- 506 Covington Cove