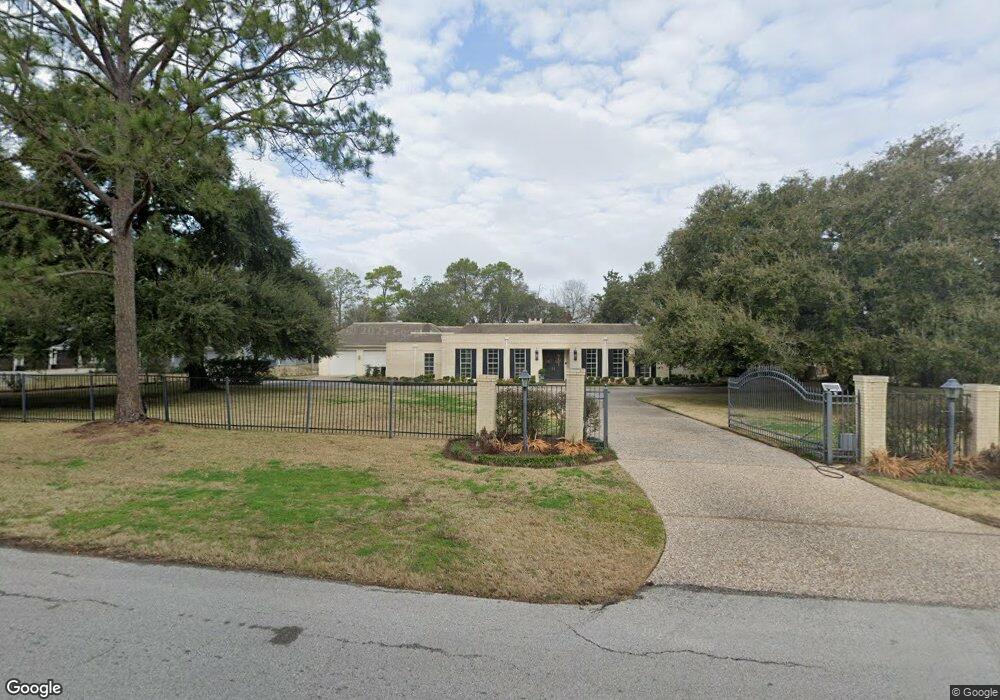
108 Hillcrest Dr Richmond, TX 77469
Estimated Value: $623,000 - $904,000
3
Beds
5
Baths
5,410
Sq Ft
$143/Sq Ft
Est. Value
About This Home
This home is located at 108 Hillcrest Dr, Richmond, TX 77469 and is currently estimated at $772,536, approximately $142 per square foot. 108 Hillcrest Dr is a home located in Fort Bend County with nearby schools including Jane Long Elementary School, J J Wessendorff Middle School, and Lamar Junior High School.
Ownership History
Date
Name
Owned For
Owner Type
Purchase Details
Closed on
Oct 20, 2020
Sold by
Witt Jana Lynn and Petty Kathryn Sue
Bought by
Gaul Terry R
Current Estimated Value
Purchase Details
Closed on
Aug 11, 2020
Sold by
Grizzard Teresa Bruno
Bought by
Russell Robert Casey and Russell Ashley Rebecca
Home Financials for this Owner
Home Financials are based on the most recent Mortgage that was taken out on this home.
Original Mortgage
$375,000
Interest Rate
3%
Mortgage Type
New Conventional
Purchase Details
Closed on
Nov 17, 2014
Sold by
Irvine Lynda Myska and Myska Cynthia
Bought by
Gaul & Wright Properties Llc
Purchase Details
Closed on
May 29, 2014
Sold by
Bleil Barbara Roane and Bleil Bert E
Bought by
Gaul Terry R
Purchase Details
Closed on
Mar 2, 2014
Sold by
Bleil Bert E and Bleil Barbara
Bought by
Gaul Terry R
Create a Home Valuation Report for This Property
The Home Valuation Report is an in-depth analysis detailing your home's value as well as a comparison with similar homes in the area
Home Values in the Area
Average Home Value in this Area
Purchase History
| Date | Buyer | Sale Price | Title Company |
|---|---|---|---|
| Gaul Terry R | -- | Stewart Title | |
| Russell Robert Casey | -- | Stewart Title | |
| Gaul & Wright Properties Llc | -- | Stewart Title | |
| Gaul Terry R | -- | Stewart Title | |
| Gaul Terry R | -- | -- |
Source: Public Records
Mortgage History
| Date | Status | Borrower | Loan Amount |
|---|---|---|---|
| Previous Owner | Russell Robert Casey | $375,000 |
Source: Public Records
Tax History Compared to Growth
Tax History
| Year | Tax Paid | Tax Assessment Tax Assessment Total Assessment is a certain percentage of the fair market value that is determined by local assessors to be the total taxable value of land and additions on the property. | Land | Improvement |
|---|---|---|---|---|
| 2025 | $8,604 | $695,234 | $61,000 | $669,579 |
| 2024 | $8,604 | $632,031 | -- | $736,243 |
| 2023 | $8,219 | $574,574 | $0 | $739,589 |
| 2022 | $10,420 | $522,340 | $0 | $668,910 |
| 2021 | $11,277 | $474,850 | $61,000 | $413,850 |
| 2020 | $11,428 | $474,180 | $61,000 | $413,180 |
| 2019 | $12,068 | $472,550 | $61,000 | $411,550 |
| 2018 | $11,560 | $449,980 | $61,000 | $388,980 |
| 2017 | $11,509 | $442,810 | $61,000 | $381,810 |
| 2016 | $11,523 | $443,340 | $61,000 | $382,340 |
| 2015 | $10,801 | $440,000 | $61,000 | $379,000 |
| 2014 | $8,042 | $362,380 | $61,000 | $301,380 |
Source: Public Records
Map
Nearby Homes
- 7315 Audubon Russet Dr
- 7322 Audubon Russet Dr
- 2143 Alabaster Estate Dr
- 400 Hillcrest Dr
- 406 Fairway Dr
- 606 Fannin St
- 303 Austin St
- 505 Austin St
- 2001 Briar Ln
- 0 Meadow Ln
- 515 S 2nd St
- 1004 Country Club Dr
- 2015 Tanglelane St
- 519 Riveredge Dr
- 1911 Winston Store Loop
- 512 and 514 Travis St
- 2008 Golden Creek Ln
- 7302 Plains Lodge Ln
- 3707 Meadow Breeze Ln
- 1810 Winston Store Loop
- 104 Hillcrest Dr
- 302 Hillcrest Dr
- 103 Hillcrest Dr
- 205 Hillcrest Dr
- 100 Hillcrest Dr
- 304 Hillcrest Dr
- 109 Hillcrest Dr
- 301 Hillcrest Dr
- 2114 Alabaster Estate Dr
- 2712 Bryan Grove Ln
- 2022 Emerald Cove Dr
- 4207 Prairie Grove Dr
- 2811 Misty Elm Ln
- 5442 Misty Valley Ln
- 2724 Bryan Grove Ln
- 2123 Alabaster Estate Dr
- 2138 Alabaster Estate Dr
- 2727 Misty Elm Ln
- 2907 Magnolia Blossom Ln
- 5454 Misty Valley Ln