108 Lake View Terrace Ellijay, GA 30536
Estimated Value: $761,494 - $1,111,000
3
Beds
3
Baths
4,070
Sq Ft
$217/Sq Ft
Est. Value
About This Home
This home is located at 108 Lake View Terrace, Ellijay, GA 30536 and is currently estimated at $883,874, approximately $217 per square foot. 108 Lake View Terrace is a home located in Gilmer County with nearby schools including Ellijay Elementary School, Clear Creek Elementary School, and Clear Creek Middle School.
Ownership History
Date
Name
Owned For
Owner Type
Purchase Details
Closed on
Jun 14, 2013
Sold by
Smith Eugene
Bought by
Earle Marc and Earle Margaret
Current Estimated Value
Home Financials for this Owner
Home Financials are based on the most recent Mortgage that was taken out on this home.
Original Mortgage
$244,000
Outstanding Balance
$173,876
Interest Rate
3.53%
Mortgage Type
New Conventional
Estimated Equity
$709,998
Purchase Details
Closed on
Aug 31, 2004
Sold by
Custom Mountain Properties Inc
Bought by
Smith Eugene H and Smith Cynthia S
Purchase Details
Closed on
Mar 28, 2002
Sold by
Graves Barbara L
Bought by
Custom Mountain Properties Inc
Purchase Details
Closed on
Mar 12, 2002
Sold by
Kenyon Steven D and Kenyon Vick
Bought by
Graves Barbara L
Purchase Details
Closed on
Dec 13, 2000
Sold by
Rivers Edge Estates
Bought by
Kenyon Steven D and Kenyon Vick
Create a Home Valuation Report for This Property
The Home Valuation Report is an in-depth analysis detailing your home's value as well as a comparison with similar homes in the area
Home Values in the Area
Average Home Value in this Area
Purchase History
| Date | Buyer | Sale Price | Title Company |
|---|---|---|---|
| Earle Marc | $305,000 | -- | |
| Smith Eugene H | $295,900 | -- | |
| Custom Mountain Properties Inc | -- | -- | |
| Graves Barbara L | $37,900 | -- | |
| Kenyon Steven D | $35,400 | -- |
Source: Public Records
Mortgage History
| Date | Status | Borrower | Loan Amount |
|---|---|---|---|
| Open | Earle Marc | $244,000 |
Source: Public Records
Tax History Compared to Growth
Tax History
| Year | Tax Paid | Tax Assessment Tax Assessment Total Assessment is a certain percentage of the fair market value that is determined by local assessors to be the total taxable value of land and additions on the property. | Land | Improvement |
|---|---|---|---|---|
| 2024 | $3,836 | $285,960 | $18,400 | $267,560 |
| 2023 | $3,962 | $285,960 | $18,400 | $267,560 |
| 2022 | $3,945 | $245,360 | $17,600 | $227,760 |
| 2021 | $3,189 | $166,600 | $17,480 | $149,120 |
| 2020 | $3,411 | $155,080 | $17,480 | $137,600 |
| 2019 | $3,512 | $155,080 | $17,480 | $137,600 |
| 2018 | $3,581 | $156,080 | $17,480 | $138,600 |
| 2017 | $3,150 | $128,040 | $17,480 | $110,560 |
| 2016 | $3,192 | $127,160 | $15,400 | $111,760 |
| 2015 | $2,584 | $104,800 | $15,400 | $89,400 |
| 2014 | $2,644 | $103,200 | $15,400 | $87,800 |
| 2013 | -- | $98,040 | $12,320 | $85,720 |
Source: Public Records
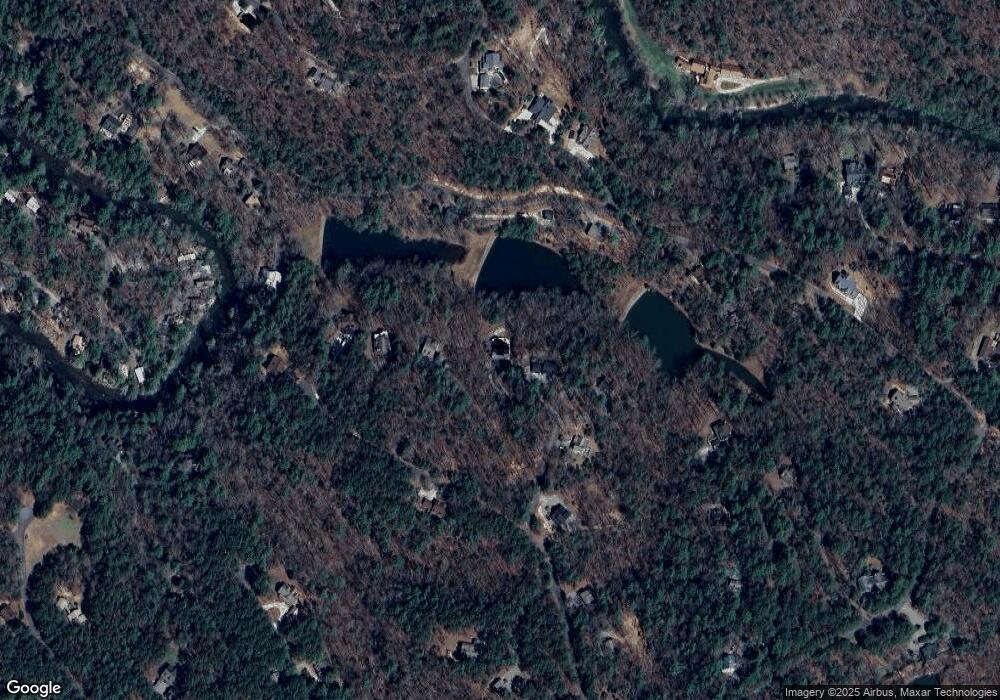
Map
Nearby Homes
- 143 Hidden Lake Cir
- 50 Misty Oaks Ct
- 44 Cartecay Ct
- 335 Misty Hollow Rd
- 105 Riveredge Dr
- 77 Long View Ln
- 88 Pauls Ln
- 80 Stegall Mill Ridge
- 80 Stegall Mill Ridge Unit 31
- 1930 Blackberry Mountain Rd
- 31&32 Fox Paw Leaf Ln
- LOT 26 Fox Paw Leaf Ln
- 0 Foxpaw Leaf Ln Unit LOT 20
- 0 Foxpaw Leaf Ln Unit 38
- 0 Foxpaw Leaf Ln Unit 7675080
- 0 Foxpaw Leaf Ln Unit 7675161
- 83 Licklog Rd
- 108 Lakeview Terrace
- 84 Lake View Terrace
- 130 Lake View Terrace
- 130 Lakeview Terrace
- 264 Lake View Ln Unit 50
- 264 Lake View Ln
- 72 Lake View Terrace Unit 54
- 72 Lake View Terrace
- 72 Lakeview Terrace Unit 54
- 72 Lakeview Terrace
- 264 Lakeview Ln
- 62 Lake View Terrace
- 62 Lakeview Terrace
- 62 Lakeview Terrace Unit 55
- 1189 Lazy River Ln
- 1189 Lazy River Ln Unit 43
- Lot 38 Lakeview Ln
- LT 39 Lakeview Ln
- LT 58 Lakeview Ln
- 203 Lake View Ln