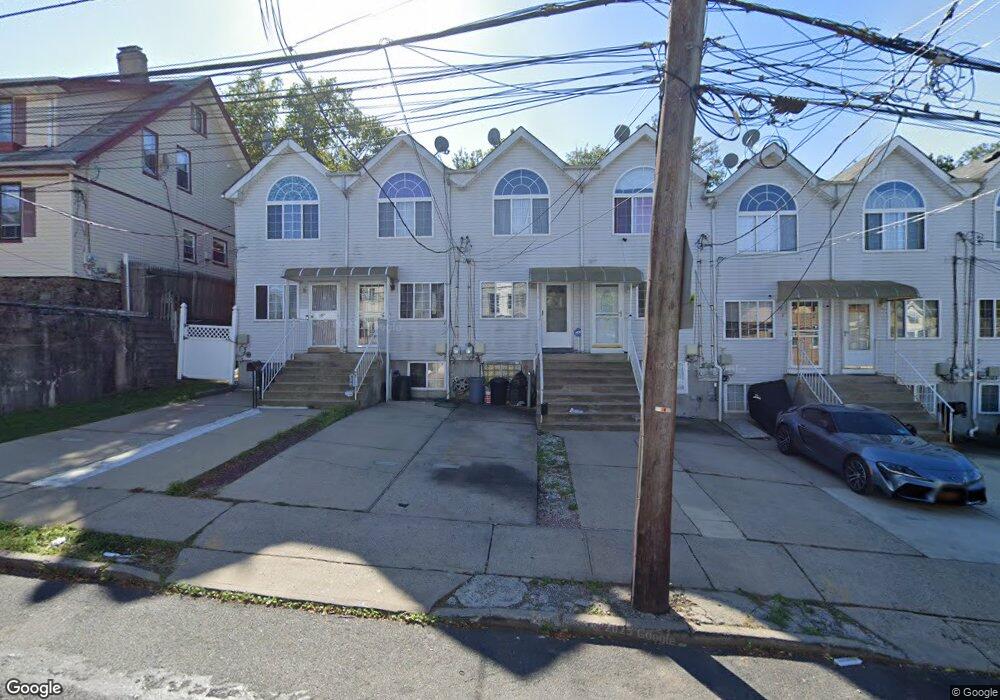
108 Laurel Ave Unit C Staten Island, NY 10304
Stapleton NeighborhoodEstimated Value: $551,000 - $576,653
3
Beds
2
Baths
1,356
Sq Ft
$415/Sq Ft
Est. Value
About This Home
This home is located at 108 Laurel Ave Unit C, Staten Island, NY 10304 and is currently estimated at $562,913, approximately $415 per square foot. 108 Laurel Ave Unit C is a home located in Richmond County with nearby schools including P.S. 78, P.S./I.S. 78Q Early Childhood Center, and I.S. 49 Berta A Dreyfus.
Ownership History
Date
Name
Owned For
Owner Type
Purchase Details
Closed on
Jan 3, 2007
Sold by
Leung Chung Chiu and Leung Yi Hung
Bought by
Leung Chung Chiu and Leung Yi Hung
Current Estimated Value
Home Financials for this Owner
Home Financials are based on the most recent Mortgage that was taken out on this home.
Original Mortgage
$196,000
Outstanding Balance
$101,649
Interest Rate
5.66%
Mortgage Type
Purchase Money Mortgage
Estimated Equity
$461,264
Purchase Details
Closed on
Jan 31, 2002
Sold by
First Home Properties Llc
Bought by
Ambrose Michael
Home Financials for this Owner
Home Financials are based on the most recent Mortgage that was taken out on this home.
Original Mortgage
$196,910
Interest Rate
6.85%
Mortgage Type
FHA
Purchase Details
Closed on
Sep 17, 2001
Sold by
Ricca Joseph
Bought by
First Home Properties Llc
Create a Home Valuation Report for This Property
The Home Valuation Report is an in-depth analysis detailing your home's value as well as a comparison with similar homes in the area
Home Values in the Area
Average Home Value in this Area
Purchase History
| Date | Buyer | Sale Price | Title Company |
|---|---|---|---|
| Leung Chung Chiu | -- | The Judicial Title Insurance | |
| Ambrose Michael | $200,000 | Fidelity National Title Ins | |
| First Home Properties Llc | $148,000 | Fidelity National Title Ins |
Source: Public Records
Mortgage History
| Date | Status | Borrower | Loan Amount |
|---|---|---|---|
| Open | Leung Chung Chiu | $196,000 | |
| Previous Owner | Ambrose Michael | $196,910 |
Source: Public Records
Tax History Compared to Growth
Tax History
| Year | Tax Paid | Tax Assessment Tax Assessment Total Assessment is a certain percentage of the fair market value that is determined by local assessors to be the total taxable value of land and additions on the property. | Land | Improvement |
|---|---|---|---|---|
| 2025 | $3,988 | $34,200 | $3,617 | $30,583 |
| 2024 | $4,000 | $29,100 | $4,251 | $24,849 |
| 2023 | $3,932 | $20,759 | $3,933 | $16,826 |
| 2022 | $3,623 | $26,700 | $5,820 | $20,880 |
| 2021 | $3,648 | $27,780 | $5,820 | $21,960 |
| 2020 | $3,453 | $25,860 | $5,820 | $20,040 |
| 2019 | $3,412 | $28,080 | $5,820 | $22,260 |
| 2018 | $3,229 | $17,299 | $5,009 | $12,290 |
| 2017 | $3,027 | $16,320 | $5,820 | $10,500 |
| 2016 | $2,818 | $15,645 | $4,818 | $10,827 |
| 2015 | $2,528 | $14,760 | $4,860 | $9,900 |
| 2014 | $2,528 | $14,760 | $4,860 | $9,900 |
Source: Public Records
Map
Nearby Homes
- 108 Laurel Ave
- 108 Laurel Ave Unit A
- 108C Laurel Ave
- 108B Laurel Ave
- 110 Laurel Ave
- 108A Laurel Ave
- 106 Laurel Ave
- 104 Laurel Ave
- 112 Laurel Ave
- 102 Laurel Ave
- 100 Laurel Ave
- 98 Laurel Ave
- 98 1/2 Laurel Ave
- 107 Osgood Ave
- 103 Osgood Ave
- 18 Coursen Ct
- 101 Osgood Ave
- 101 Osgood Ave Unit 2
- 99 Osgood Ave
- 122 Warren St