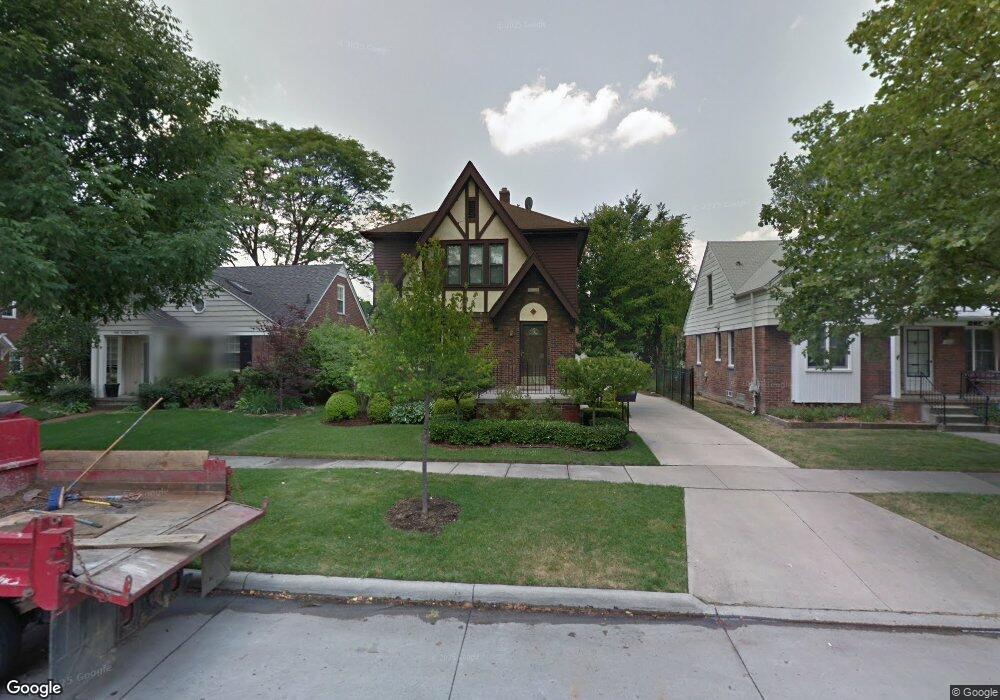
108 Maplefield Rd Unit Bldg-Unit Pleasant Ridge, MI 48069
Estimated Value: $442,602 - $527,000
3
Beds
2
Baths
1,569
Sq Ft
$307/Sq Ft
Est. Value
About This Home
This home is located at 108 Maplefield Rd Unit Bldg-Unit, Pleasant Ridge, MI 48069 and is currently estimated at $482,401, approximately $307 per square foot. 108 Maplefield Rd Unit Bldg-Unit is a home located in Oakland County with nearby schools including Ferndale Upper Elementary Campus, Ferndale Lower Elementary Campus, and Ferndale Middle School.
Ownership History
Date
Name
Owned For
Owner Type
Purchase Details
Closed on
Apr 15, 2022
Sold by
Andrew Snedeker Calvin and Andrew Angela
Bought by
Caverly Shelby Marie and Cooney Patrick Martin
Current Estimated Value
Purchase Details
Closed on
Apr 22, 2019
Sold by
Swaninger Roger L and Swaninger Janice L
Bought by
Snedeker Calvin Andrew and Munaco Angela
Home Financials for this Owner
Home Financials are based on the most recent Mortgage that was taken out on this home.
Original Mortgage
$299,250
Interest Rate
4.2%
Mortgage Type
Purchase Money Mortgage
Purchase Details
Closed on
Jun 10, 2015
Sold by
Swaninger Roger I and Swaninger Janice L
Bought by
Roger I Swaninger & Janice L Swaniger Re and Swaninger Janice L
Create a Home Valuation Report for This Property
The Home Valuation Report is an in-depth analysis detailing your home's value as well as a comparison with similar homes in the area
Home Values in the Area
Average Home Value in this Area
Purchase History
| Date | Buyer | Sale Price | Title Company |
|---|---|---|---|
| Caverly Shelby Marie | $435,000 | None Listed On Document | |
| Snedeker Calvin Andrew | $315,000 | Title Source Inc | |
| Roger I Swaninger & Janice L Swaniger Re | -- | Attorney |
Source: Public Records
Mortgage History
| Date | Status | Borrower | Loan Amount |
|---|---|---|---|
| Previous Owner | Snedeker Calvin Andrew | $299,250 |
Source: Public Records
Tax History
| Year | Tax Paid | Tax Assessment Tax Assessment Total Assessment is a certain percentage of the fair market value that is determined by local assessors to be the total taxable value of land and additions on the property. | Land | Improvement |
|---|---|---|---|---|
| 2025 | $7,444 | $176,490 | $0 | $0 |
| 2024 | $7,110 | $164,300 | $0 | $0 |
| 2023 | $6,799 | $150,810 | $0 | $0 |
| 2022 | $6,242 | $146,300 | $0 | $0 |
| 2021 | $5,974 | $133,690 | $0 | $0 |
| 2020 | $5,687 | $126,850 | $0 | $0 |
| 2019 | $3,450 | $115,310 | $0 | $0 |
| 2018 | $3,377 | $107,230 | $0 | $0 |
| 2017 | $3,322 | $104,340 | $0 | $0 |
| 2016 | $3,327 | $96,040 | $0 | $0 |
| 2015 | -- | $83,910 | $0 | $0 |
| 2014 | -- | $79,040 | $0 | $0 |
| 2011 | -- | $67,860 | $0 | $0 |
Source: Public Records
Map
Nearby Homes
- 86 Oakdale Blvd
- 93 Oakdale Blvd
- 8503 Colgate St
- 19 Oakdale Blvd
- 23844 Republic Ave
- 24800 Republic Ave
- 24 Ridge Rd
- 910 W Drayton
- 920 W Maplehurst St
- 910 W Maplehurst St
- 928 W Maplehurst Ave
- 24070 Rosewood St
- 0 Rosewood St
- 11 Poplar Park Blvd
- 23230 Sherman St
- 23241 Republic Ave
- 861 W Lewiston Ave
- 24541 Pine Village Blvd Unit 54
- 703 W Lewiston Ave
- 1915 Central St
- 108 Maplefield Rd
- 110 Maplefield Rd
- 106 Maplefield Rd
- 102 Maplefield Rd
- 114 Maplefield Rd
- 24170 Sherman St
- 24180 Sherman St
- 24164 Sherman St
- 100 Maplefield Rd
- 24190 Sherman St
- 24160 Sherman St
- 120 Maplefield Rd
- 24302 Sherman St
- 111 Maplefield Rd
- 103 Maplefield Rd
- 115 Maplefield Rd
- 99 Maplefield Rd
- 24150 Sherman St
- 96 Maplefield Rd
- 122 Maplefield Rd
Your Personal Tour Guide
Ask me questions while you tour the home.