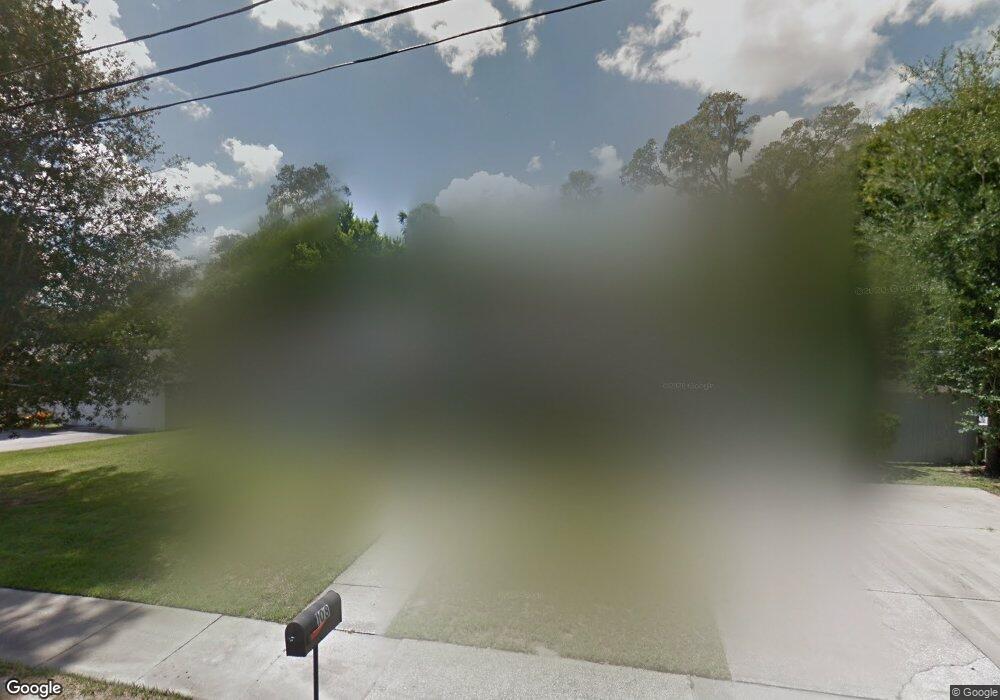
108 N Boundary Ave Deland, FL 32720
Estimated Value: $222,000 - $249,000
2
Beds
1
Bath
1,794
Sq Ft
$131/Sq Ft
Est. Value
About This Home
This home is located at 108 N Boundary Ave, Deland, FL 32720 and is currently estimated at $235,229, approximately $131 per square foot. 108 N Boundary Ave is a home located in Volusia County with nearby schools including Woodward Avenue Elementary School, Deland High School, and Southwestern Middle School.
Ownership History
Date
Name
Owned For
Owner Type
Purchase Details
Closed on
Dec 30, 2016
Sold by
Paul Chris
Bought by
Mckeehan Wade L
Current Estimated Value
Home Financials for this Owner
Home Financials are based on the most recent Mortgage that was taken out on this home.
Original Mortgage
$129,200
Outstanding Balance
$105,921
Interest Rate
3.94%
Mortgage Type
New Conventional
Estimated Equity
$129,308
Purchase Details
Closed on
Sep 1, 2016
Sold by
Stinson David
Bought by
Paul Chris
Purchase Details
Closed on
Jun 18, 2012
Sold by
Schneider Anthony J and Schneider Celia A
Bought by
Maher Stinson Dawn M
Home Financials for this Owner
Home Financials are based on the most recent Mortgage that was taken out on this home.
Original Mortgage
$58,814
Interest Rate
3.86%
Mortgage Type
FHA
Purchase Details
Closed on
May 15, 1990
Bought by
Stinson David
Create a Home Valuation Report for This Property
The Home Valuation Report is an in-depth analysis detailing your home's value as well as a comparison with similar homes in the area
Home Values in the Area
Average Home Value in this Area
Purchase History
| Date | Buyer | Sale Price | Title Company |
|---|---|---|---|
| Mckeehan Wade L | $136,000 | Westside Title Services Inc | |
| Paul Chris | $83,100 | Adams Cameron Title Services | |
| Maher Stinson Dawn M | $59,900 | Downtown Title Services Inc | |
| Stinson David | $42,500 | -- |
Source: Public Records
Mortgage History
| Date | Status | Borrower | Loan Amount |
|---|---|---|---|
| Open | Mckeehan Wade L | $129,200 | |
| Previous Owner | Maher Stinson Dawn M | $58,814 |
Source: Public Records
Tax History Compared to Growth
Tax History
| Year | Tax Paid | Tax Assessment Tax Assessment Total Assessment is a certain percentage of the fair market value that is determined by local assessors to be the total taxable value of land and additions on the property. | Land | Improvement |
|---|---|---|---|---|
| 2025 | $1,362 | $104,789 | -- | -- |
| 2024 | $1,362 | $101,836 | -- | -- |
| 2023 | $1,362 | $98,870 | $0 | $0 |
| 2022 | $1,309 | $95,990 | $0 | $0 |
| 2021 | $1,330 | $93,194 | $0 | $0 |
| 2020 | $1,303 | $91,907 | $0 | $0 |
| 2019 | $1,321 | $89,841 | $0 | $0 |
| 2018 | $1,296 | $88,166 | $0 | $0 |
| 2017 | $1,265 | $86,353 | $15,478 | $70,875 |
| 2016 | $714 | $46,418 | $0 | $0 |
| 2015 | $743 | $46,095 | $0 | $0 |
| 2014 | $734 | $45,729 | $0 | $0 |
Source: Public Records
Map
Nearby Homes
- W SR 44, New York Ave W
- 128 S Montgomery Ave
- 807 W Church St
- 0 N Spring Garden Ave Unit MFRO6340602
- 0 N Spring Garden Ave Unit 1112700
- 0 N Spring Garden Ave Unit V4920996
- 111 N Stone St
- 621 W Indiana Ave Unit 13
- 241 S Marydell Ave
- 131 S Stone St
- 247 S Marydell Ave
- 236 N Salisbury Ave
- 305 S Stone St
- 134 S Julia Ave
- 817 W Euclid Ave
- 1126 W Minnesota Ave
- 1141 W Euclid Ave
- 600 N Boundary Ave Unit 119B
- 600 N Boundary Ave Unit 110A
- 600 N Boundary Ave Unit 114-C
- 112 N Boundary Ave
- 901 W New York Ave
- N Boundary Ave
- N Boundary Ave
- N Boundary Ave
- 909 W New York Ave
- 116 N Boundary Ave
- 111 Stewart Ave
- 111 Stewart Ave Unit 3
- 111 Stewart Ave Unit 1
- 111 Stewart Ave Unit 2
- 111 Stewart Ave Unit 4
- 911 W New York Ave
- 113 Stewart Ave
- 118 N Boundary Ave
- 915 W New York Ave
- 120 N Boundary Ave Unit B
- 120 N Boundary Ave
- 117 Stewart Ave
- 916 W New York Ave Unit 103A