Estimated Value: $90,000 - $201,000
3
Beds
2
Baths
1,144
Sq Ft
$133/Sq Ft
Est. Value
About This Home
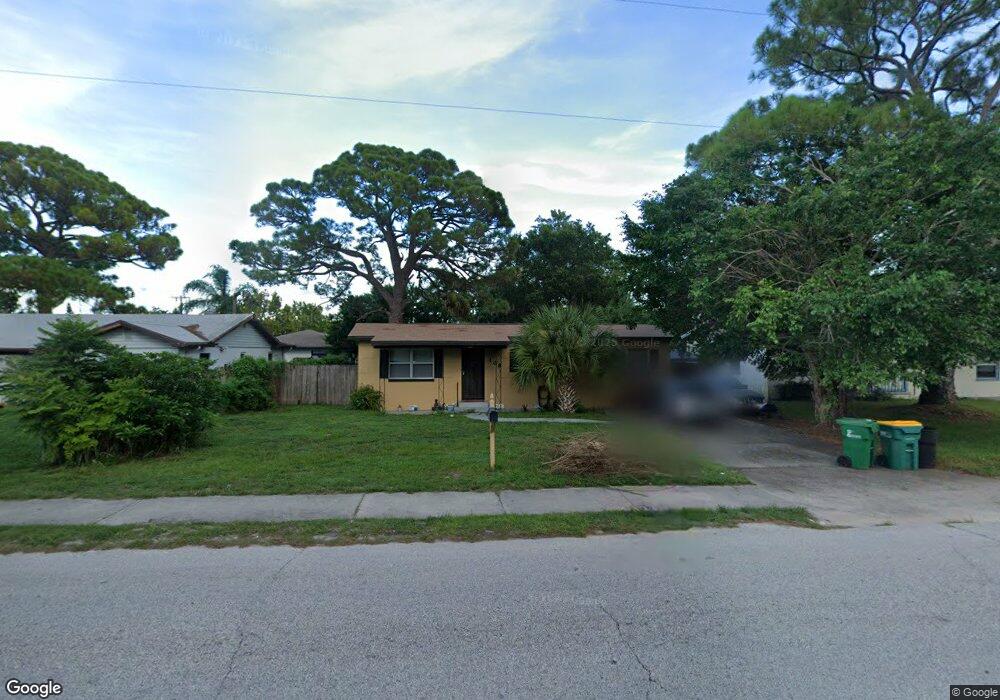
This home is located at 108 N Fiske Blvd, Cocoa, FL 32922 and is currently estimated at $151,969, approximately $132 per square foot. 108 N Fiske Blvd is a home located in Brevard County with nearby schools including Endeavour Elementary Magnet, Cocoa High School, and Emma Jewel Charter Academy.
Ownership History
Date
Name
Owned For
Owner Type
Purchase Details
Closed on
Feb 22, 2019
Sold by
Candor Property Solutions Llc
Bought by
Mercurio Robert
Current Estimated Value
Purchase Details
Closed on
Nov 21, 2017
Sold by
Stambaugh Joan E
Bought by
Larson Larry T and Larson Tony
Purchase Details
Closed on
Nov 10, 2017
Sold by
Stambaugh David W
Bought by
Larson Larry T and Larson Tony
Purchase Details
Closed on
Feb 17, 2016
Sold by
Larson Richard A
Bought by
Larson Larry T and Larson Carolyn
Purchase Details
Closed on
Feb 1, 2016
Bought by
Larson Tony
Purchase Details
Closed on
Nov 26, 2013
Sold by
Larson Larry T and Larson Carolyn
Bought by
Larson Richard Allen
Purchase Details
Closed on
Apr 22, 2010
Sold by
Stambaugh Joan E
Bought by
Larson Tony
Purchase Details
Closed on
Apr 21, 2010
Sold by
Stambaugh David W
Bought by
Larson Tony
Purchase Details
Closed on
Feb 2, 2009
Sold by
Stambaugh David W and The Larry T Larson Trust
Bought by
Swindells Luella J and Larson Gene S
Create a Home Valuation Report for This Property
The Home Valuation Report is an in-depth analysis detailing your home's value as well as a comparison with similar homes in the area
Home Values in the Area
Average Home Value in this Area
Purchase History
| Date | Buyer | Sale Price | Title Company |
|---|---|---|---|
| Mercurio Robert | $56,000 | Nona Title Inc | |
| Candor Property Solutions Llc | $50,000 | Nona Title Inc | |
| Larson Larry T | $3,700 | Attorney | |
| Larson Larry T | $3,700 | Attorney | |
| Larson Larry T | -- | Attorney | |
| Larson Tony | $100 | -- | |
| Larson Richard Allen | -- | None Available | |
| Larson Tony | -- | None Available | |
| Larson Tony | -- | None Available | |
| Swindells Luella J | -- | Attorney |
Source: Public Records
Tax History Compared to Growth
Tax History
| Year | Tax Paid | Tax Assessment Tax Assessment Total Assessment is a certain percentage of the fair market value that is determined by local assessors to be the total taxable value of land and additions on the property. | Land | Improvement |
|---|---|---|---|---|
| 2025 | $1,679 | $103,280 | -- | -- |
| 2024 | $1,414 | $105,540 | -- | -- |
| 2023 | $1,414 | $71,880 | $0 | $0 |
| 2022 | $1,221 | $61,460 | $0 | $0 |
| 2021 | $1,078 | $40,770 | $3,000 | $37,770 |
| 2020 | $1,060 | $40,770 | $3,000 | $37,770 |
| 2019 | $1,055 | $41,260 | $3,000 | $38,260 |
| 2018 | $953 | $41,560 | $3,000 | $38,560 |
| 2017 | $880 | $34,160 | $3,000 | $31,160 |
| 2016 | $841 | $32,220 | $3,000 | $29,220 |
| 2015 | $782 | $27,270 | $3,000 | $24,270 |
| 2014 | $708 | $25,780 | $3,000 | $22,780 |
Source: Public Records
Map
Nearby Homes
- 919 Fern Ave
- 305 Prospect Ave
- 406 N Fiske Blvd
- 406 Prospect Ave
- 1103 Bellefonte Ave
- 824 Temple St
- 418 Churchill Dr
- 701 Thomas Ave
- 506 Stone St
- 535 S Kentucky Ave
- 1237 Holmes St
- Xxxx S Fiske Blvd
- 128 Aurora St
- 351 Pine Ave
- 535 Bernard St
- 1108 Bristol Dr
- 0 Highway Us 1 Unit 1000884
- 145 Ruth Ave
- 135 Highland St
- 800 N Fiske Blvd Unit 603