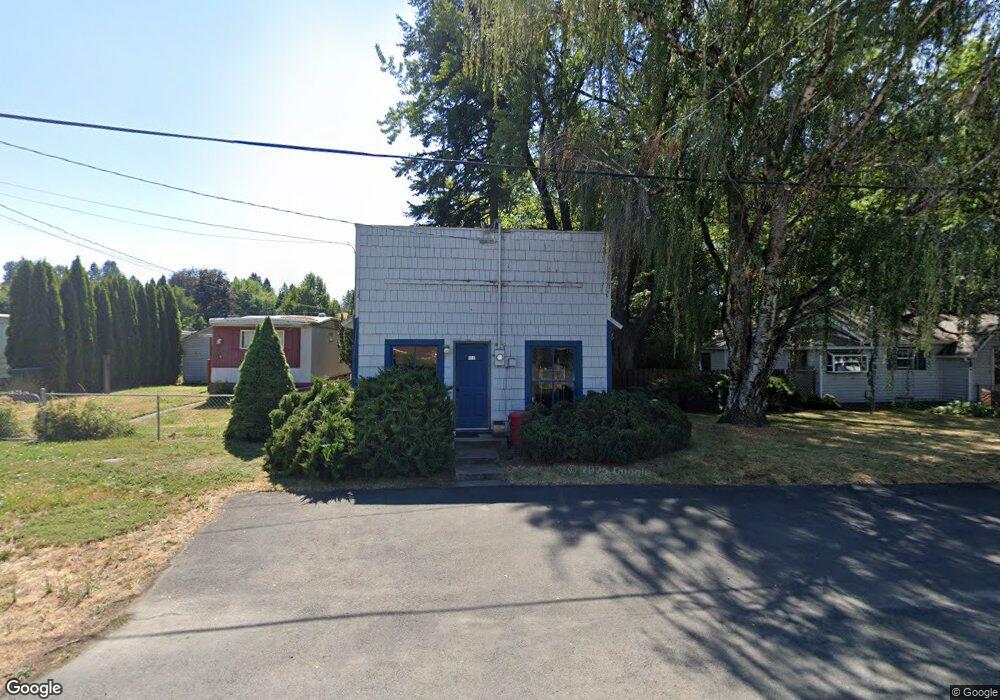
108 N Main St Unit 2 for the price of 1 Albion, WA 99102
Estimated Value: $92,420 - $208,000
1
Bed
1
Bath
520
Sq Ft
$335/Sq Ft
Est. Value
About This Home
This home is located at 108 N Main St Unit 2 for the price of 1, Albion, WA 99102 and is currently estimated at $174,105, approximately $334 per square foot. 108 N Main St Unit 2 for the price of 1 is a home located in Whitman County with nearby schools including Pullman High School.
Create a Home Valuation Report for This Property
The Home Valuation Report is an in-depth analysis detailing your home's value as well as a comparison with similar homes in the area
Home Values in the Area
Average Home Value in this Area
Tax History Compared to Growth
Tax History
| Year | Tax Paid | Tax Assessment Tax Assessment Total Assessment is a certain percentage of the fair market value that is determined by local assessors to be the total taxable value of land and additions on the property. | Land | Improvement |
|---|---|---|---|---|
| 2025 | $92 | $8,717 | $6,440 | $2,277 |
| 2024 | $95 | $7,580 | $5,600 | $1,980 |
| 2023 | $97 | $7,580 | $5,600 | $1,980 |
| 2022 | $98 | $7,580 | $5,600 | $1,980 |
| 2021 | $99 | $7,580 | $5,600 | $1,980 |
| 2020 | $104 | $7,580 | $5,600 | $1,980 |
| 2019 | $92 | $7,580 | $5,600 | $1,980 |
| 2018 | $101 | $7,580 | $5,600 | $1,980 |
| 2017 | $98 | $7,580 | $5,600 | $1,980 |
| 2016 | $110 | $7,580 | $5,600 | $1,980 |
| 2015 | $104 | $7,580 | $5,600 | $1,980 |
| 2014 | -- | $7,400 | $5,600 | $1,800 |
Source: Public Records
Map
Nearby Homes
- 114 N H St
- 523 SW Crithfield
- 31 Golden Wheat Ln
- 11 Golden Wheat Ln
- 2 Golden Wheat Ln
- 7XX Armstrong Rd
- 2085 NW Overlook Dr
- 1970 NW Ventura Ct
- TBD NW Valley View Dr
- 1925 NW Ventura Ct
- 1920 NW Bella Vista Dr
- 2030 NW Canyon View Dr
- 450 NW Terre View Dr
- 440 NW Terre View Dr
- 1810 NW Bella Vista Dr
- 1800 NW Bella Vista Dr
- 1225 NW Ventura Dr
- 1625 NW Valhalla Dr
- 485 NW Thomas St
- 2515 NW Wallingford Ct