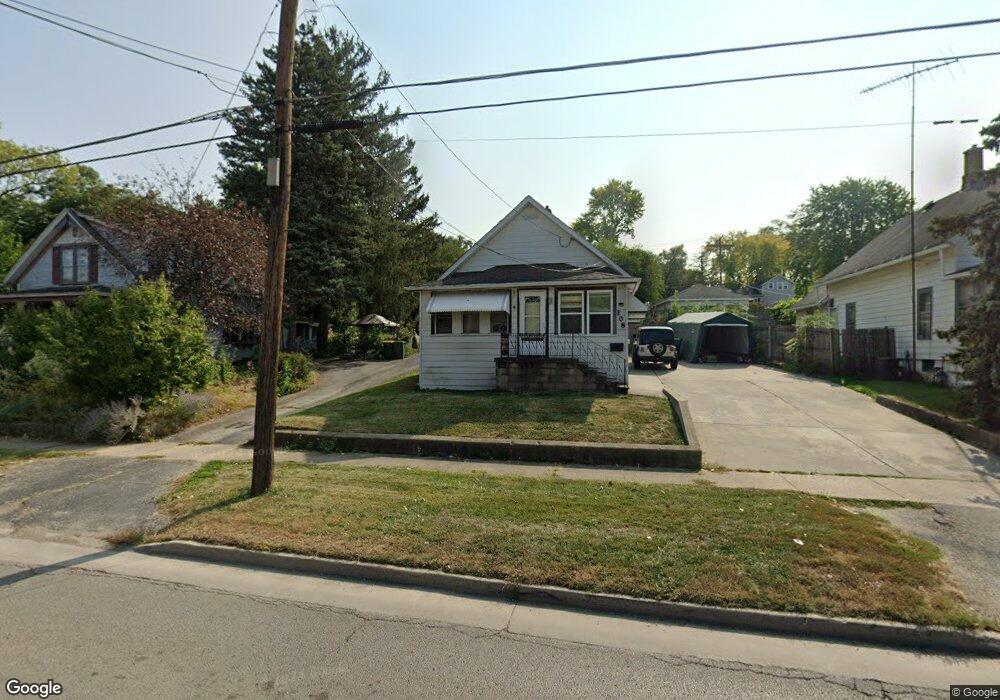
108 N State St Lockport, IL 60441
Estimated Value: $214,675 - $295,000
--
Bed
--
Bath
--
Sq Ft
7,405
Sq Ft Lot
About This Home
This home is located at 108 N State St, Lockport, IL 60441 and is currently estimated at $252,669. 108 N State St is a home located in Will County with nearby schools including Ludwig Elementary School, Walsh Elementary School, and Reed Elementary School.
Ownership History
Date
Name
Owned For
Owner Type
Purchase Details
Closed on
Jan 29, 2020
Sold by
Jones Jackie A
Bought by
Jones Jackie A and Jones Jennifer L
Current Estimated Value
Purchase Details
Closed on
Sep 2, 2006
Sold by
Craddock Henry W and Craddock Barbara J
Bought by
Jones Jackie A
Home Financials for this Owner
Home Financials are based on the most recent Mortgage that was taken out on this home.
Original Mortgage
$128,000
Outstanding Balance
$88,839
Interest Rate
9.75%
Mortgage Type
Purchase Money Mortgage
Estimated Equity
$163,831
Purchase Details
Closed on
Dec 8, 1994
Sold by
Frausto Ralph and Frausto Mary W
Bought by
Craddock Henry W and Craddock Barbara J
Home Financials for this Owner
Home Financials are based on the most recent Mortgage that was taken out on this home.
Original Mortgage
$87,447
Interest Rate
9.27%
Mortgage Type
Assumption
Create a Home Valuation Report for This Property
The Home Valuation Report is an in-depth analysis detailing your home's value as well as a comparison with similar homes in the area
Home Values in the Area
Average Home Value in this Area
Purchase History
| Date | Buyer | Sale Price | Title Company |
|---|---|---|---|
| Jones Jackie A | -- | Attorney | |
| Jones Jackie A | $128,000 | Chicago Title Insurance Co | |
| Craddock Henry W | $85,000 | Attorneys Title Guaranty Fun |
Source: Public Records
Mortgage History
| Date | Status | Borrower | Loan Amount |
|---|---|---|---|
| Open | Jones Jackie A | $128,000 | |
| Previous Owner | Craddock Henry W | $87,447 |
Source: Public Records
Tax History Compared to Growth
Tax History
| Year | Tax Paid | Tax Assessment Tax Assessment Total Assessment is a certain percentage of the fair market value that is determined by local assessors to be the total taxable value of land and additions on the property. | Land | Improvement |
|---|---|---|---|---|
| 2024 | $5,309 | $71,912 | $25,594 | $46,318 |
| 2023 | $5,309 | $64,559 | $22,977 | $41,582 |
| 2022 | $4,316 | $55,096 | $19,609 | $35,487 |
| 2021 | $4,046 | $51,777 | $18,428 | $33,349 |
| 2020 | $3,929 | $50,074 | $17,822 | $32,252 |
| 2019 | $3,693 | $47,464 | $16,893 | $30,571 |
| 2018 | $3,609 | $45,625 | $16,239 | $29,386 |
| 2017 | $3,428 | $43,071 | $15,330 | $27,741 |
| 2016 | $3,028 | $38,227 | $13,606 | $24,621 |
| 2015 | -- | $34,313 | $12,213 | $22,100 |
| 2014 | -- | $31,480 | $11,205 | $20,275 |
| 2013 | -- | $31,480 | $11,205 | $20,275 |
Source: Public Records
Map
Nearby Homes
- 120 N State St
- 118 N State St
- 219 S Washington St
- 327 S State St
- 134 S Jefferson St
- 101 Market St
- 540 E 4th St
- 247 E North St
- 814 S Washington St
- 613 Katherine St
- 800 Madison St Unit 2C
- 1016 S State St
- 1006 S Jefferson St
- 200 E 11th St
- 807 Valley Ln
- 609 Oak St
- 1009 Mccameron Ave Unit 1
- 1108 E 9th St
- 1111 S Lincoln St
- 1107 Garfield St
- 102 N State St
- 116 N State St
- 106 Thornton St
- 100 N State St
- 101 S Hamilton St
- 107 N Hamilton St
- 108 Thornton St
- 103 S Hamilton St
- 111 N Hamilton St
- 104 E 2nd St
- 113 N State St
- 111 N State St
- 102 E 2nd St
- 121 N State St
- 118 E 2nd St
- 125 N State St
- 117 N Hamilton St
- 132 N State St
- 129 N State St
- 128 E 2nd St