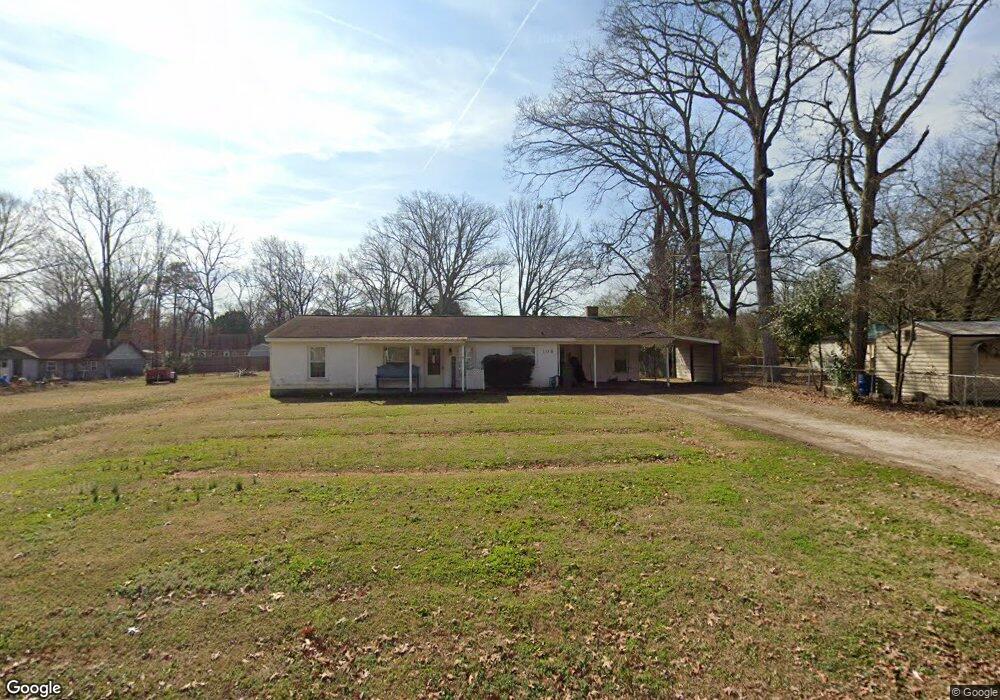
108 Oak Ave SW Griffin, GA 30224
Spalding County NeighborhoodEstimated Value: $164,000 - $212,000
3
Beds
1
Bath
1,540
Sq Ft
$121/Sq Ft
Est. Value
About This Home
This home is located at 108 Oak Ave SW, Griffin, GA 30224 and is currently estimated at $186,297, approximately $120 per square foot. 108 Oak Ave SW is a home located in Spalding County with nearby schools including Crescent Road Elementary School, Rehoboth Road Middle School, and Spalding High School.
Ownership History
Date
Name
Owned For
Owner Type
Purchase Details
Closed on
Mar 18, 2024
Sold by
Clevenger Robert Lee
Bought by
Clevenger Ashley and Clevenger Robert Lee
Current Estimated Value
Purchase Details
Closed on
Aug 24, 2019
Sold by
Gray Bill R
Bought by
Clevenger Robert Lee
Purchase Details
Closed on
Aug 31, 2006
Sold by
Whatley David L and Whatley William R
Bought by
Gray Bill R and Gray Jewel L
Home Financials for this Owner
Home Financials are based on the most recent Mortgage that was taken out on this home.
Original Mortgage
$48,000
Interest Rate
6.73%
Mortgage Type
New Conventional
Purchase Details
Closed on
Apr 9, 1985
Sold by
Whatley Clara Estelle
Bought by
Whatley Jerry Dennis Etal
Purchase Details
Closed on
Jun 1, 1984
Sold by
Whatley Alton B
Bought by
Whatley Clara Estelle
Purchase Details
Closed on
Apr 20, 1984
Bought by
Whatley Clara Estelle
Purchase Details
Closed on
Apr 3, 1954
Bought by
Whatley Alton B
Create a Home Valuation Report for This Property
The Home Valuation Report is an in-depth analysis detailing your home's value as well as a comparison with similar homes in the area
Home Values in the Area
Average Home Value in this Area
Purchase History
| Date | Buyer | Sale Price | Title Company |
|---|---|---|---|
| Clevenger Ashley | -- | -- | |
| Clevenger Robert Lee | $9,500 | -- | |
| Gray Bill R | $60,000 | -- | |
| Whatley Jerry Dennis Etal | -- | -- | |
| Whatley Clara Estelle | -- | -- | |
| Whatley Clara Estelle | -- | -- | |
| Whatley Alton B | -- | -- |
Source: Public Records
Mortgage History
| Date | Status | Borrower | Loan Amount |
|---|---|---|---|
| Previous Owner | Gray Bill R | $48,000 |
Source: Public Records
Tax History Compared to Growth
Tax History
| Year | Tax Paid | Tax Assessment Tax Assessment Total Assessment is a certain percentage of the fair market value that is determined by local assessors to be the total taxable value of land and additions on the property. | Land | Improvement |
|---|---|---|---|---|
| 2024 | $1,572 | $43,933 | $6,000 | $37,933 |
| 2023 | $1,572 | $43,933 | $6,000 | $37,933 |
| 2022 | $1,665 | $45,798 | $4,000 | $41,798 |
| 2021 | $1,463 | $40,230 | $4,000 | $36,230 |
| 2020 | $1,387 | $40,230 | $4,000 | $36,230 |
| 2019 | $791 | $21,257 | $3,200 | $18,057 |
| 2018 | $0 | $19,534 | $3,200 | $16,334 |
| 2017 | $217 | $19,390 | $3,200 | $16,190 |
| 2016 | $239 | $20,540 | $3,200 | $17,340 |
| 2015 | $254 | $20,540 | $3,200 | $17,340 |
| 2014 | $265 | $20,540 | $3,200 | $17,340 |
Source: Public Records
Map
Nearby Homes
- 1801, 1831 & 19 Zebulon Rd
- 101 Coldwater Ln
- TRACT B Zebulon Rd
- 109 Maddox Rd
- 1082 Coldwater Dr
- 114 Maddox Rd
- 133 Coldwater Ln
- 201 Laramie Rd
- 145 Coldwater Way
- 1064 Cold Water Dr
- 139 Coldwater Ln
- 202 Hillandale Dr
- 316 Wynterhall Dr
- 106 Summit Dr
- 227 Brown Acres Rd
- 1374 Zebulon Rd
- 115 Kline Cir
- 311 Ashford Place
- 1541 Zebulon Rd & Unit 4 TRACTS 35 ACRES
- 107 Southside Dr
- 108 Oak Ave SW
- 112 Woodlawn Ave
- 116 Woodlawn Ave
- 110 Oak Ave SW
- 118 Woodlawn Ave
- 107 Oak Ave SW
- 123 Pine Ave SW
- 109 Oak Ave SW
- 110 Woodlawn Ave
- 112 Oak Ave SW
- 121 Pine Ave SW
- 120 Woodlawn Ave
- 111 Oak Ave SW
- 117 Woodlawn Ave
- 111 Woodlawn Ave
- 116 Oak Ave SW
- 113 Oak Ave SW
- 115 Woodlawn Ave
- 117 Pine Ave SW
- 134 Airport Rd