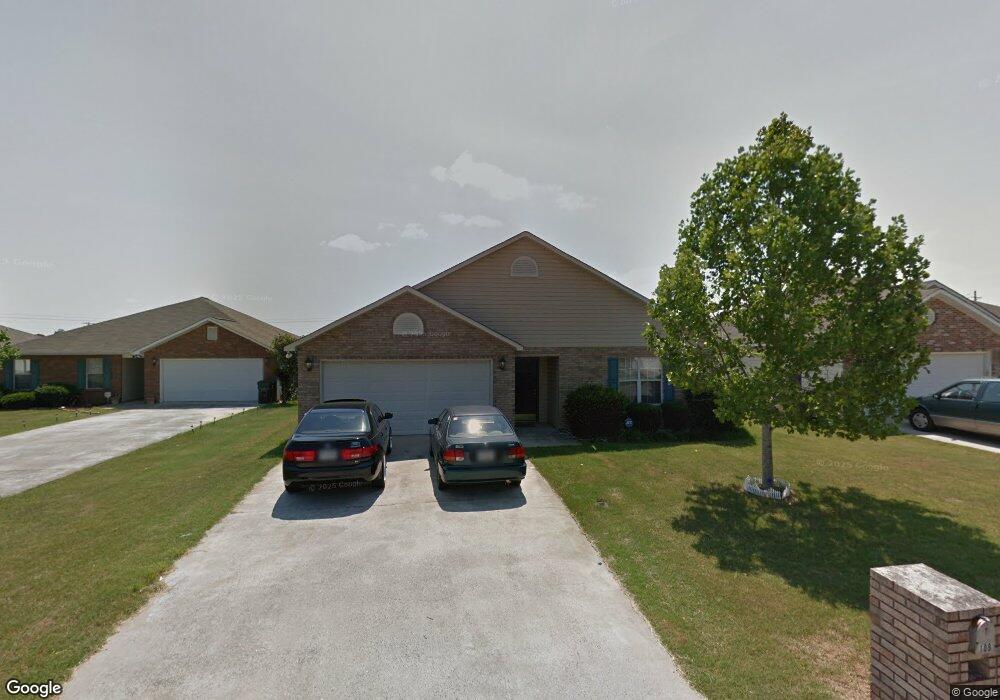
108 Onyx Ct Warner Robins, GA 31093
Estimated Value: $200,000 - $210,628
3
Beds
2
Baths
1,513
Sq Ft
$137/Sq Ft
Est. Value
About This Home
This home is located at 108 Onyx Ct, Warner Robins, GA 31093 and is currently estimated at $206,907, approximately $136 per square foot. 108 Onyx Ct is a home located in Houston County with nearby schools including Northside Elementary School, Northside Middle School, and Northside High School.
Ownership History
Date
Name
Owned For
Owner Type
Purchase Details
Closed on
Oct 24, 2008
Sold by
Secretary Of Housing & Urban Development
Bought by
Gouch Roderick
Current Estimated Value
Home Financials for this Owner
Home Financials are based on the most recent Mortgage that was taken out on this home.
Original Mortgage
$98,353
Outstanding Balance
$64,389
Interest Rate
6.11%
Mortgage Type
FHA
Estimated Equity
$142,518
Purchase Details
Closed on
May 6, 2008
Sold by
Chase Home Finance Llc
Bought by
Hud
Purchase Details
Closed on
Apr 24, 2001
Sold by
International City Dev Inc
Bought by
Johnson Raymond H
Purchase Details
Closed on
Mar 21, 2000
Bought by
International City Dev Inc
Create a Home Valuation Report for This Property
The Home Valuation Report is an in-depth analysis detailing your home's value as well as a comparison with similar homes in the area
Home Values in the Area
Average Home Value in this Area
Purchase History
| Date | Buyer | Sale Price | Title Company |
|---|---|---|---|
| Gouch Roderick | -- | None Available | |
| Hud | -- | None Available | |
| Chase Home Finance Llc | $91,604 | None Available | |
| Chase Home Finance Llc | $91,600 | -- | |
| Johnson Raymond H | $91,500 | -- | |
| International City Dev Inc | -- | -- |
Source: Public Records
Mortgage History
| Date | Status | Borrower | Loan Amount |
|---|---|---|---|
| Open | Gouch Roderick | $98,353 |
Source: Public Records
Tax History Compared to Growth
Tax History
| Year | Tax Paid | Tax Assessment Tax Assessment Total Assessment is a certain percentage of the fair market value that is determined by local assessors to be the total taxable value of land and additions on the property. | Land | Improvement |
|---|---|---|---|---|
| 2024 | $2,126 | $64,960 | $8,000 | $56,960 |
| 2023 | $1,952 | $59,200 | $6,000 | $53,200 |
| 2022 | $1,159 | $50,400 | $4,200 | $46,200 |
| 2021 | $971 | $42,000 | $4,200 | $37,800 |
| 2020 | $951 | $40,920 | $4,200 | $36,720 |
| 2019 | $951 | $40,920 | $4,200 | $36,720 |
| 2018 | $951 | $40,920 | $4,200 | $36,720 |
| 2017 | $952 | $40,920 | $4,200 | $36,720 |
| 2016 | $953 | $40,920 | $4,200 | $36,720 |
| 2015 | -- | $40,920 | $4,200 | $36,720 |
| 2014 | $412 | $40,920 | $4,200 | $36,720 |
| 2013 | $412 | $41,240 | $4,200 | $37,040 |
Source: Public Records
Map
Nearby Homes
- 112 Haag Dr
- 109 Haag Dr
- 104 Hughes Dr
- 719 Meadowridge Dr
- 111 Thorndale Dr
- 709 Meadowridge Dr
- 317 Emory Dr
- 305 Norman Ln
- 60 Tiffany Ln
- 113 Eastlake Dr
- 201 Inglewood Dr
- 111 Briarwood Dr
- 107 Briarwood Dr
- 94 Tiffany Ln
- 100 Northspring Ct
- 302 Kensington Cir
- 113 Northwind Ct
- 208 Pellimore Dr
- 106 Tor Dr
- 118 Avalon Dr